


Save Time
Calculating and processing payroll is a tedious task that takes up time that could be better spent running your business.

Reduce Liability
You don’t need a payroll expert on staff to calculate the appropriate payroll taxes and meet the various employment-related deadlines.

Worry Less About Complexity
You don’t have to keep track of all of the changes in tax laws, withholding, reporting, and overtime rules.

Save Money
Time is money. Processing payroll in-house and keeping up with payroll regulations take countless hours of your time.
.00_00_38_07.Still003.jpg?width=1920&height=1080&name=rmz-realty_final%20(Original).00_00_38_07.Still003.jpg)


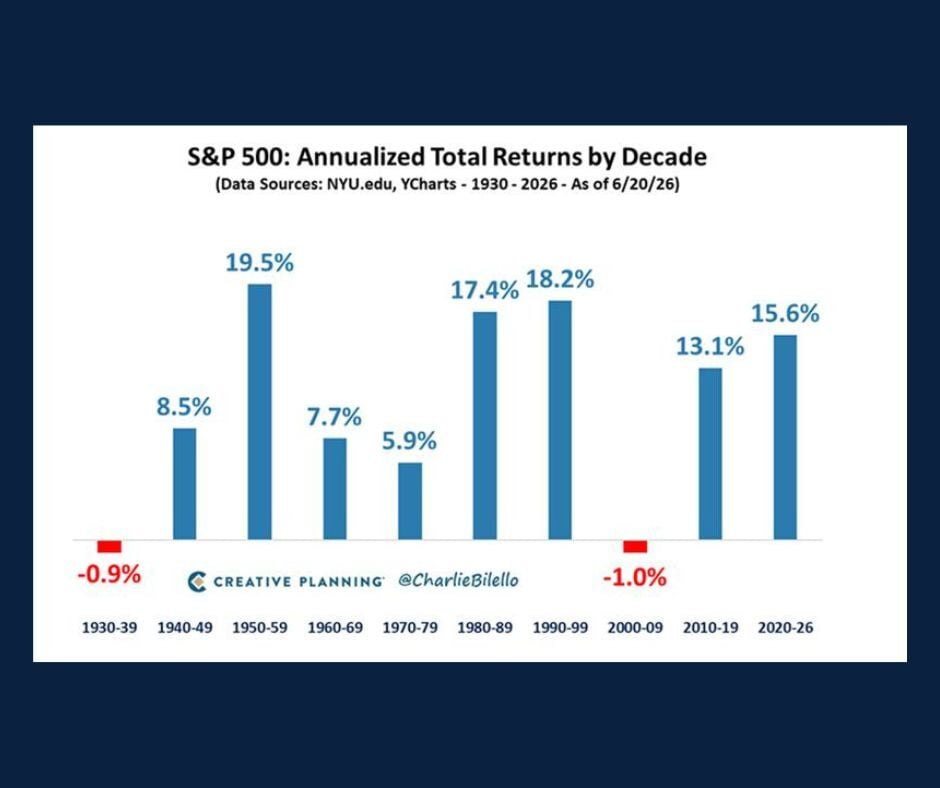
Chart of the Day: S&P By Decade
July 30, 2026
Today's Chart of the Day from Charlie Bilello’s blog, "The Week in Charts," from June 24, 2026, examines the S&P 500's performance by decade, with...
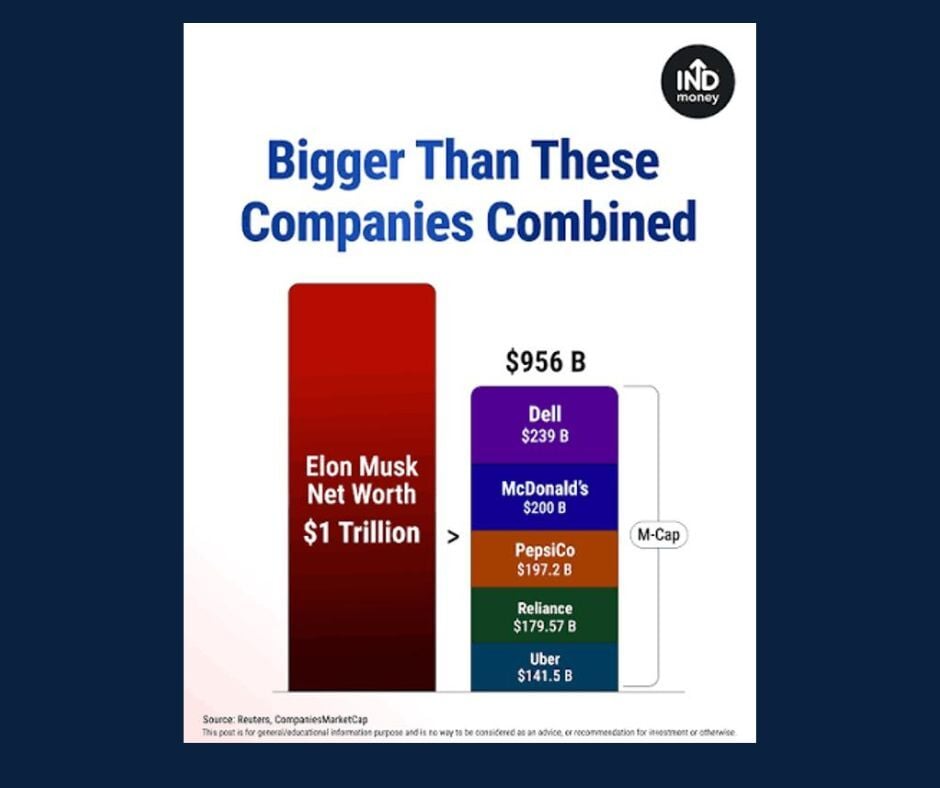
Chart of the Day: Elon Musk is Bigger
July 28, 2026
Today’s Chart of the Day comes from indmoneyapp on Instagram and compares Elon Musk’s ~ $1 trillion net worth to the market values of five well known...
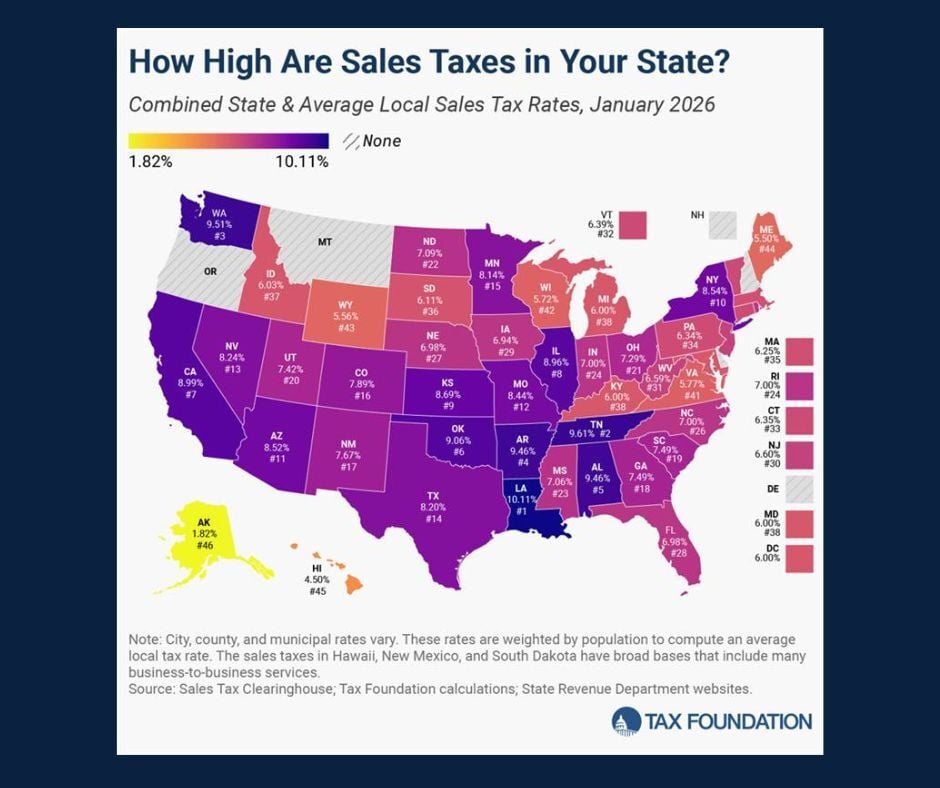
Chart of the Day: How High Sales Tax by State?
July 23, 2026
Today’s Chart of the Day from the Tax Foundation’s "2026 Sales Tax Rates | Sales Taxes by State" highlights combined state and local sales tax rates...