Chart of the Day: 30% of the Time
Contents
About the Author

All of our locations will be closed on Saturday, July 4, in celebration of Independence Day.
Take the first step toward securing your legacy. Attend a complimentary estate-planning seminar.
Investment products are not insured by the FDIC, are not deposits, and may lose value.
FDIC-Insured - Backed by the full faith and credit of the U.S. Government
BankFind
This bank is insured by the Federal Deposit Insurance Corporation. The FDIC Certificate ID is 8021. Click on the Certificate ID # to confirm this bank's FDIC coverage using the FDIC's BankFind tool.
EDIE
EDIE lets consumers and bankers know, on a per-bank basis, how the insurance rules and limits apply to a depositor's accounts-what's insured and what portion (if any) exceeds coverage limits at that bank. Check your deposit insurance coverage >>

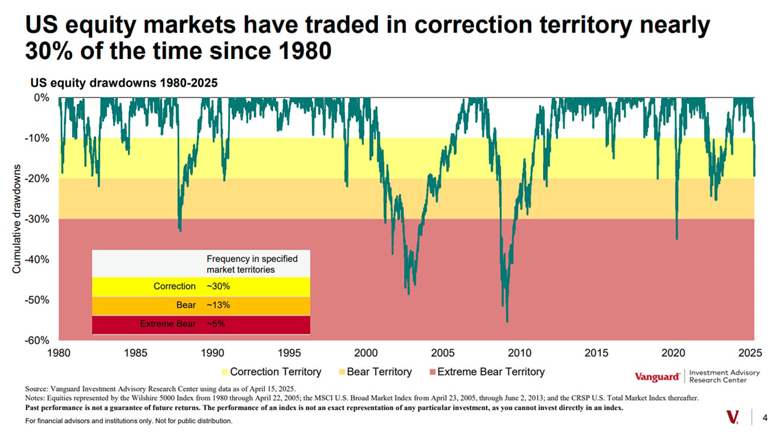
Today’s Chart of the Day is from Vanguard and shows that, since 1980, the stock market has traded in the 10%-20% down range, aka Correction Territory, 30% of the time.
Most of that time was during the Lost Decade* (1999 to 2009) but according to the chart, that’s happened 21 times over the last 40 years, which works out to an average of one correction every two years.
The chart also gives definitions used by the financial press, which are:
Fortunately, the Extreme Bear has only happened four times since 1980, or once every 10 years.
*The Lost Decade was a ten-year period from 1999 to 2009 which started after the Dot-com Bubble collapsed and was followed years later with the Great Recession. The market did not reach a new record high until 2009.
Experienced professionals from our wealth management services team can help you achieve a bright financial future through investment strategies tailored to you. We’ll show you all of the options available and help you choose the ones best suited to you. We’ll provide high-quality, personal service as we work toward your goals together. Our Portfolio Managers do not receive commissions on trades; our recommendations of investments are based solely on your best interests.
Investments are not a deposit or other obligation of, or guaranteed by, the bank, are not FDIC insured, not insured by any federal government agency, and are subject to investment risks, including possible loss of principal.