Housing Un-Affordability
Contents
About the Author

Small business? Turn your phone into an on-the-go card reader with Tap2Local.
Take the first step toward securing your legacy. Attend a complimentary estate-planning seminar.
Investment products are not insured by the FDIC, are not deposits, and may lose value.
FDIC-Insured - Backed by the full faith and credit of the U.S. Government
BankFind
This bank is insured by the Federal Deposit Insurance Corporation. The FDIC Certificate ID is 8021. Click on the Certificate ID # to confirm this bank's FDIC coverage using the FDIC's BankFind tool.
EDIE
EDIE lets consumers and bankers know, on a per-bank basis, how the insurance rules and limits apply to a depositor's accounts-what's insured and what portion (if any) exceeds coverage limits at that bank. Check your deposit insurance coverage >>

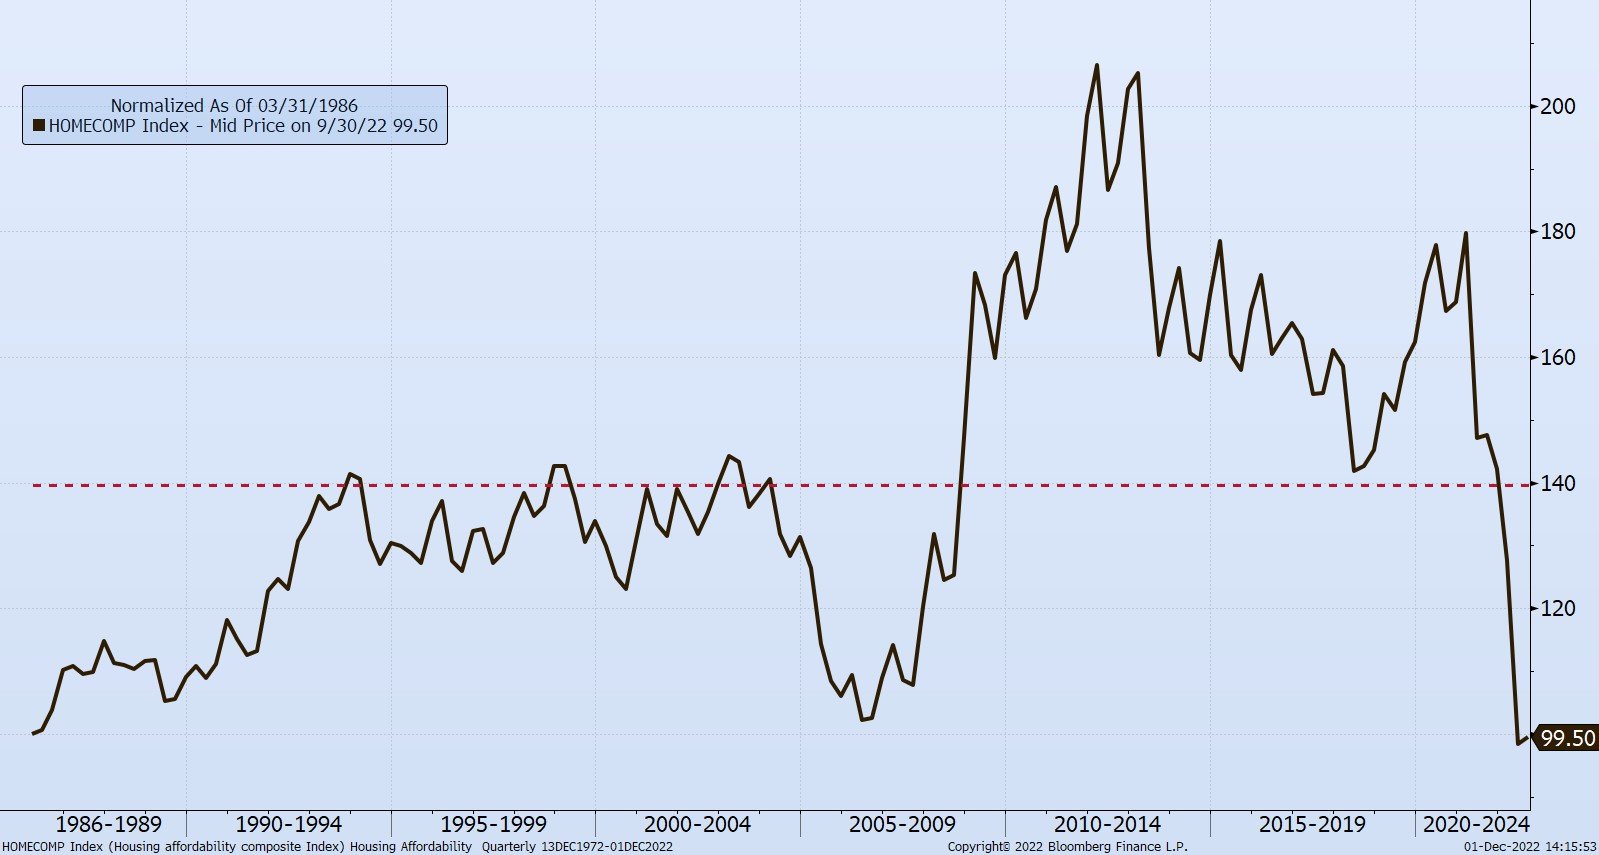
Today’s Chart of the Day is the history of the Housing Affordability Composite Index provided by the National Association of Realtors going all the way back to 1986, with the average line in dotted red.
The index measures whether or not a typical family earns enough income to qualify for a mortgage loan on a typical home based on the most recent price and income data. Earlier this year, due to increased real estate prices, flat incomes, and significantly higher mortgage rates from inflation, the index slipped not even below average, but to the lowest since just before the Great Recession.
A pessimist would say, “Don’t buy,” as this may result in falling values, and an optimist would say, “The worst is over!” as two of the other variables may improve, such as incomes increase, or mortgage rates fall as inflation subsides. As with all things, it will most likely be a combination of all three.
Experienced professionals from our wealth management services team can help you achieve a bright financial future through investment strategies tailored to you. We’ll show you all of the options available and help you choose the ones best suited to you. We’ll provide high-quality, personal service as we work toward your goals together. Our Portfolio Managers do not receive commissions on trades; our recommendations of investments are based solely on your best interests.
Investments are not a deposit or other obligation of, or guaranteed by, the bank, are not FDIC insured, not insured by any federal government agency, and are subject to investment risks, including possible loss of principal.