Speculation is Not as Important as Quality
Contents
About the Author

All of our locations will be closed on Saturday, July 4, in celebration of Independence Day.
Take the first step toward securing your legacy. Attend a complimentary estate-planning seminar.
Investment products are not insured by the FDIC, are not deposits, and may lose value.
FDIC-Insured - Backed by the full faith and credit of the U.S. Government
BankFind
This bank is insured by the Federal Deposit Insurance Corporation. The FDIC Certificate ID is 8021. Click on the Certificate ID # to confirm this bank's FDIC coverage using the FDIC's BankFind tool.
EDIE
EDIE lets consumers and bankers know, on a per-bank basis, how the insurance rules and limits apply to a depositor's accounts-what's insured and what portion (if any) exceeds coverage limits at that bank. Check your deposit insurance coverage >>

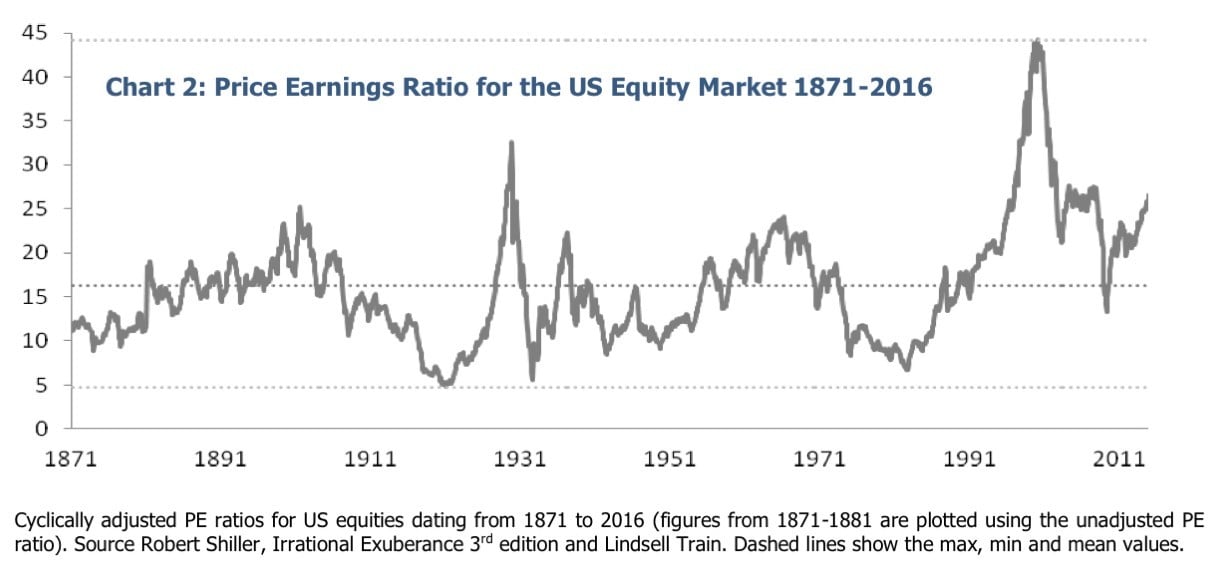
Today’s Chart of the Day comes from Robert Schiller’s book called Irrational Exuberance, which was summarized by Leandro, @Invesquotes on Twitter.
The chart shows the long-term price per earning ratio going all the way back to 1871 with an average of 16(x). This means that you pay $16 for every $1 worth of earnings of a company. With this number, you would want to pay the lowest possible for that $1; the lower the price per earning number the better.
Even if you were a perfect market timer and bought when the price to earning was at its lowest of all time, 5(x) in 1920, and sold when the market was at its highest, 44(x) in 1999, meaning you were the all-time winner of the buy-low sell-high game, this would have only added 3% to your combined 15% annual return.
In a nutshell, even with the perfect coin toss for all the ages, the benefits of timing the market are not as relevant as the underlying performance of the companies and the earnings they return back to you over the long run.
Experienced professionals from our wealth management services team can help you achieve a bright financial future through investment strategies tailored to you. We’ll show you all of the options available and help you choose the ones best suited to you. We’ll provide high-quality, personal service as we work toward your goals together. Our Portfolio Managers do not receive commissions on trades; our recommendations of investments are based solely on your best interests.
Investments are not a deposit or other obligation of, or guaranteed by, the bank, are not FDIC insured, not insured by any federal government agency, and are subject to investment risks, including possible loss of principal.