Chart of the Day: US Birth Rates
Contents
About the Author

Take the first step toward securing your legacy. Attend a complimentary estate-planning seminar.
Investment products are not insured by the FDIC, are not deposits, and may lose value.
FDIC-Insured - Backed by the full faith and credit of the U.S. Government
BankFind
This bank is insured by the Federal Deposit Insurance Corporation. The FDIC Certificate ID is 8021. Click on the Certificate ID # to confirm this bank's FDIC coverage using the FDIC's BankFind tool.
EDIE
EDIE lets consumers and bankers know, on a per-bank basis, how the insurance rules and limits apply to a depositor's accounts-what's insured and what portion (if any) exceeds coverage limits at that bank. Check your deposit insurance coverage >>

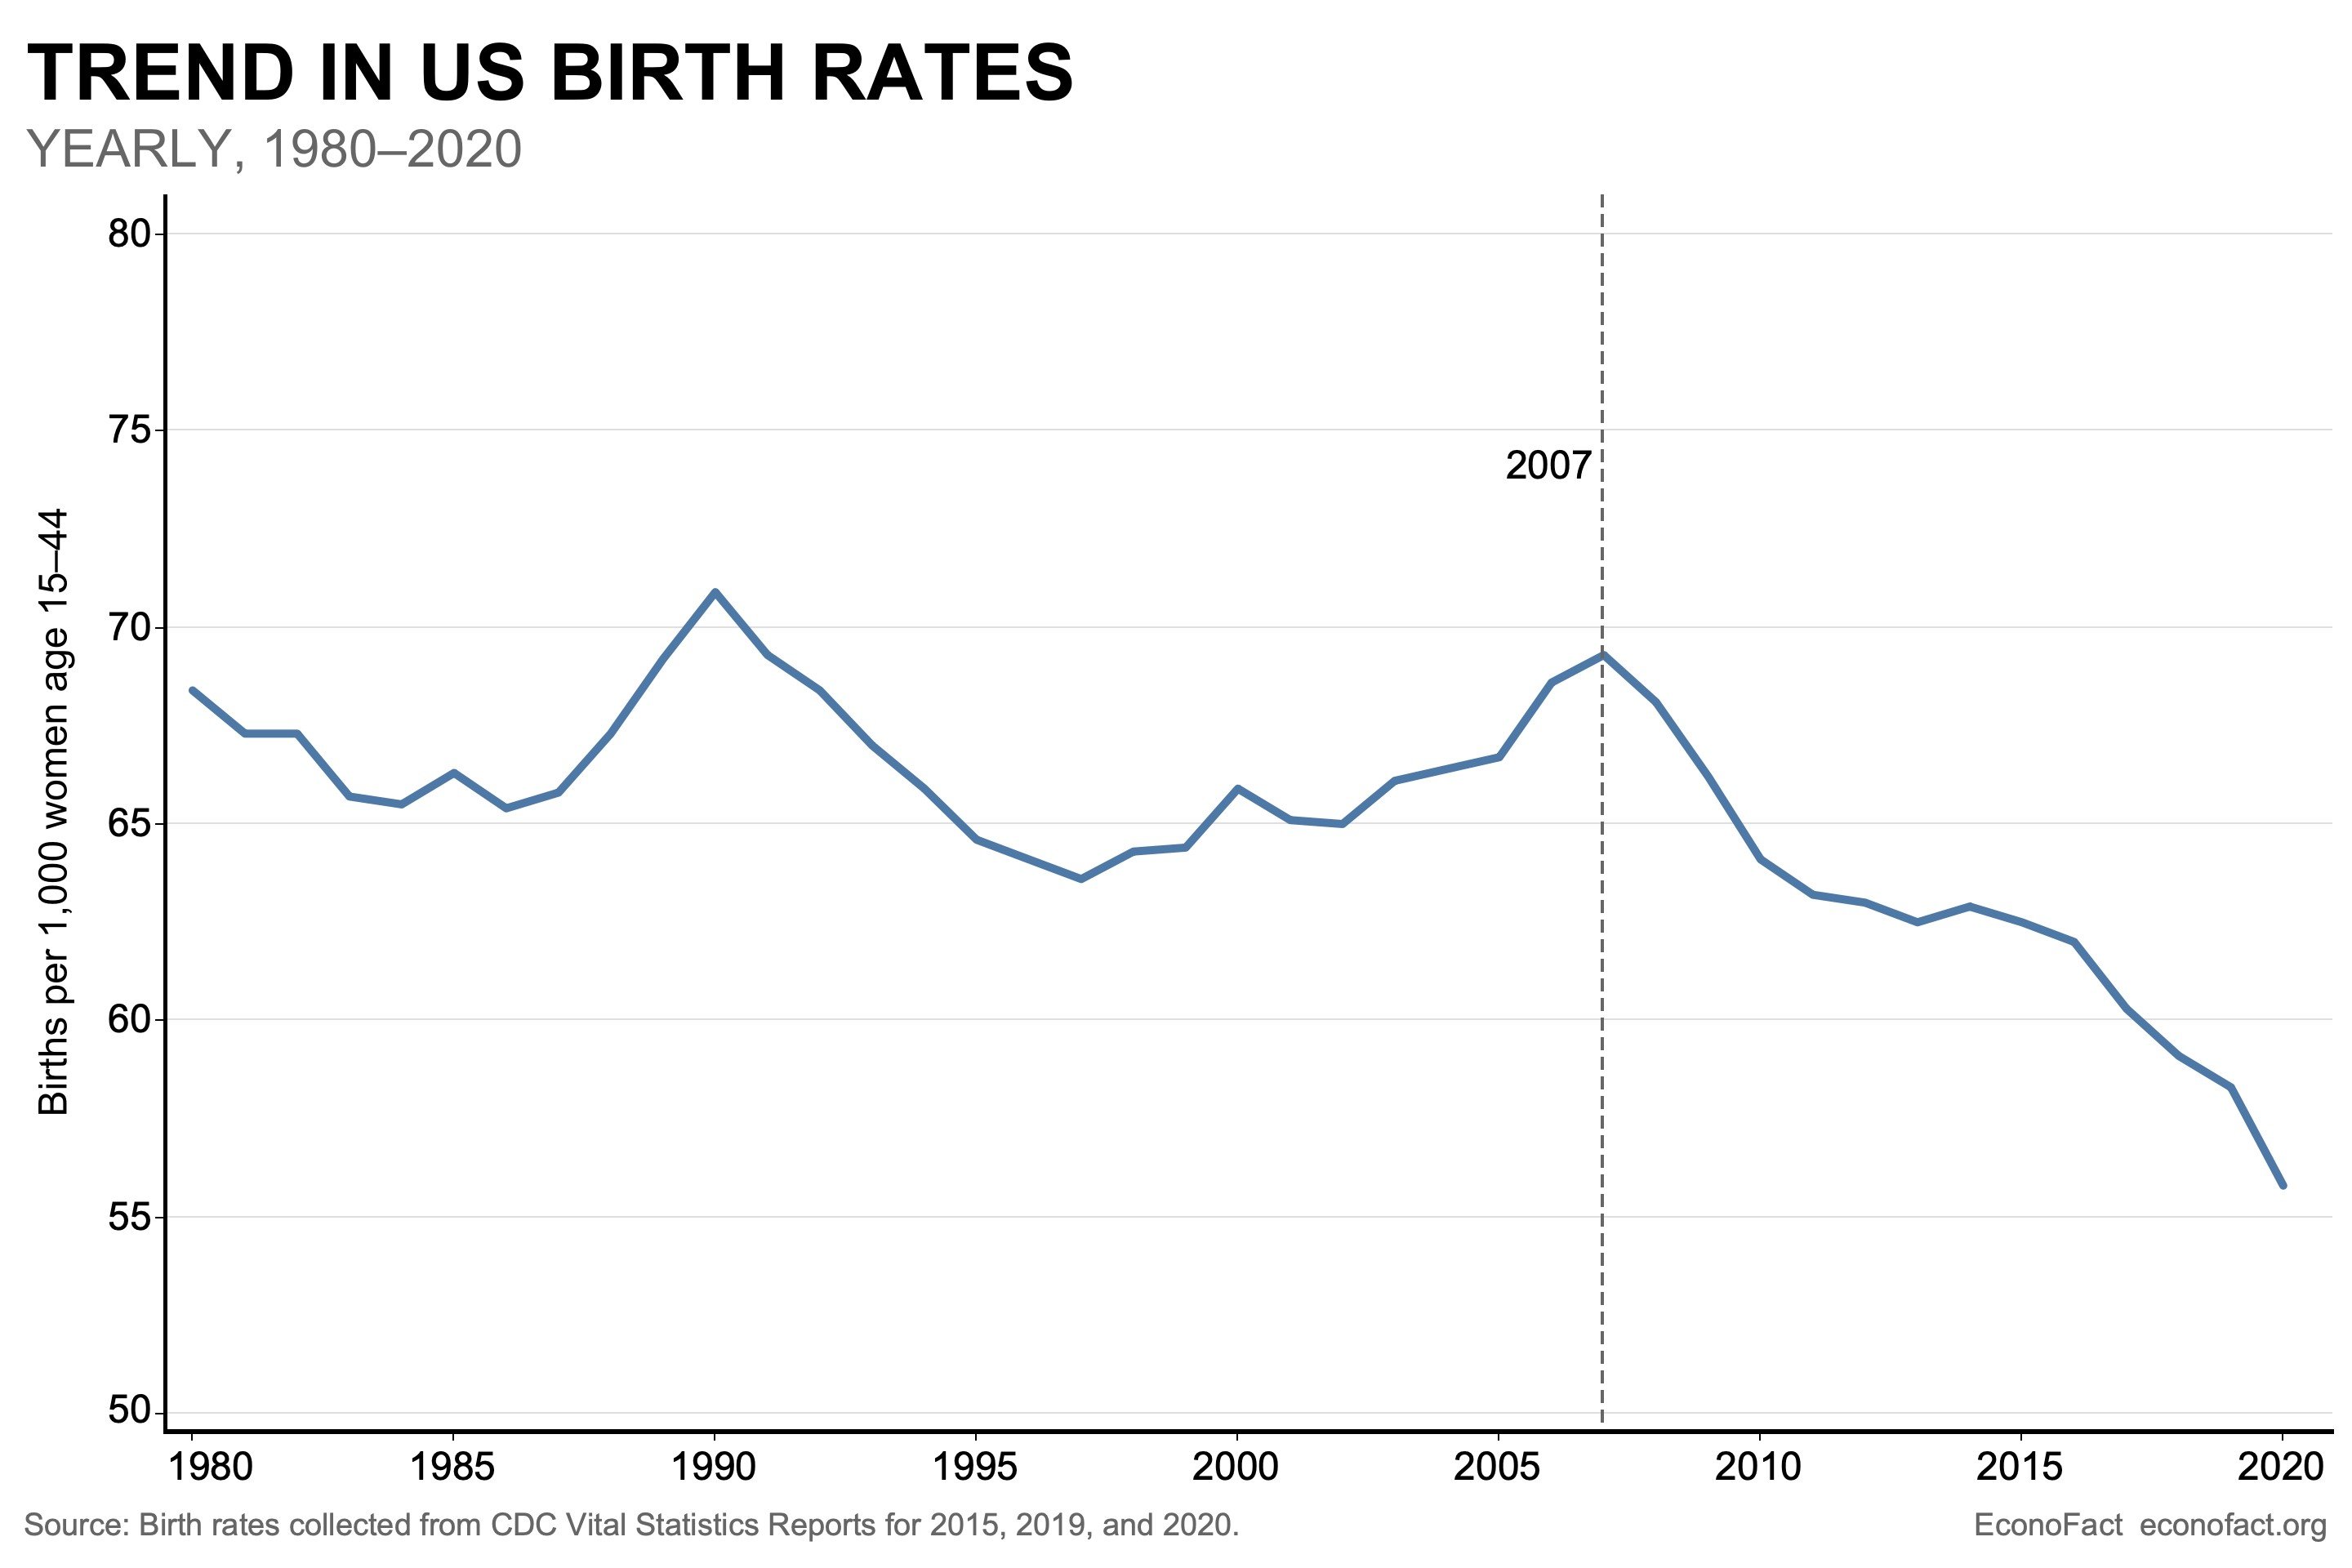
Today’s Chart of the Day from Econofact.org shows the trend in US birth rates which peaked in 2007 and is now 20% less. In the study of economics and finance, the topic “How many people will be in the future?” is paramount. Imagine the economic differences between one million or one billion people. This difference would impact productivity, replacement of jobs, and continued transfer payments.
The article discusses the decline coinciding with the Great Recession, which is common during economic downturns; however, in this case, the birth rates have not returned to the long-term norm. The article goes on to explain the reason is that younger adults now have different preferences on having children, life aspirations, and parenting norms.
Oddly enough, this is a common issue in developed countries, such as Japan. Overall, however, the population of the world continues to grow as birth rates have accelerated in other parts of Asia.
Experienced professionals from our wealth management services team can help you achieve a bright financial future through investment strategies tailored to you. We’ll show you all of the options available and help you choose the ones best suited to you. We’ll provide high-quality, personal service as we work toward your goals together. Our Portfolio Managers do not receive commissions on trades; our recommendations of investments are based solely on your best interests.
Investments are not a deposit or other obligation of, or guaranteed by, the bank, are not FDIC insured, not insured by any federal government agency, and are subject to investment risks, including possible loss of principal.