Factors Over Time
Contents
About the Author

Take the first step toward securing your legacy. Attend a complimentary estate-planning seminar.
Investment products are not insured by the FDIC, are not deposits, and may lose value.
FDIC-Insured - Backed by the full faith and credit of the U.S. Government
BankFind
This bank is insured by the Federal Deposit Insurance Corporation. The FDIC Certificate ID is 8021. Click on the Certificate ID # to confirm this bank's FDIC coverage using the FDIC's BankFind tool.
EDIE
EDIE lets consumers and bankers know, on a per-bank basis, how the insurance rules and limits apply to a depositor's accounts-what's insured and what portion (if any) exceeds coverage limits at that bank. Check your deposit insurance coverage >>

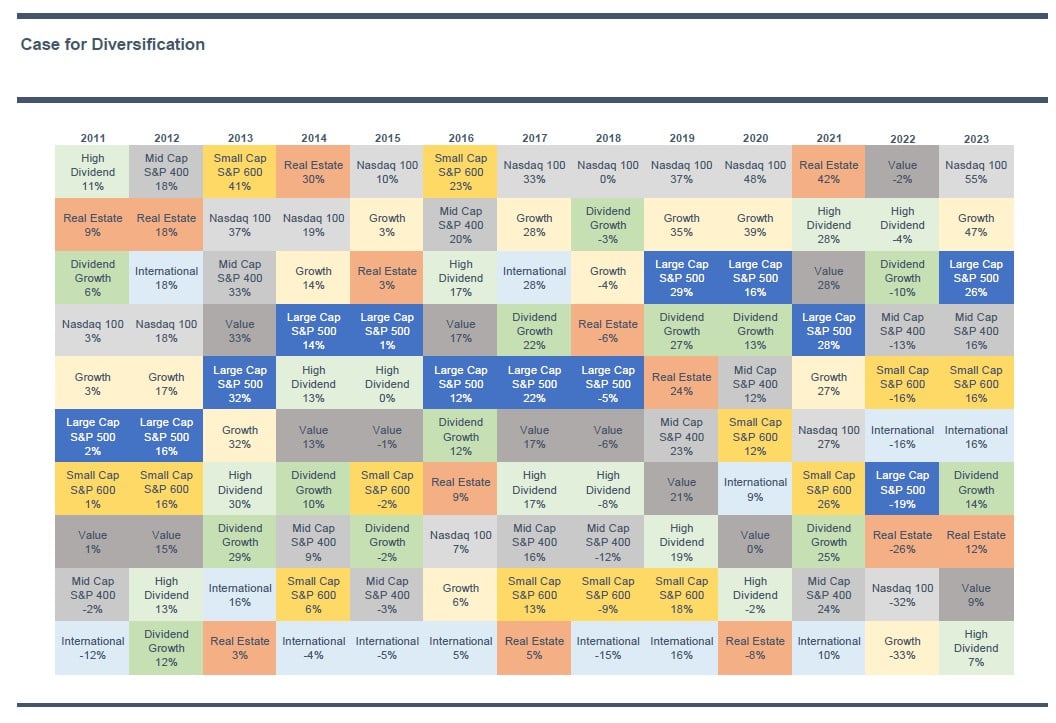
Today’s Chart of the Day is a perennial favorite for some clients and shows the annual stock market performance of several factors. "Factors" is the name the market assigns to certain types of stocks. For instance: Growth stocks are those that have higher growth rates and often do not have a dividend; vs. Value stocks which are generally older, more established, and pay a dividend. Other factors are Small, Mid, and Large, Real Estate, International, and High Dividend. The “Chiclet Chart," as one client calls it, displays how each factor performs as compared to the others over time. It makes a visual case to be diversified into each to reduce volatility, since some do better one year and not the next.
Experienced professionals from our wealth management services team can help you achieve a bright financial future through investment strategies tailored to you. We’ll show you all of the options available and help you choose the ones best suited to you. We’ll provide high-quality, personal service as we work toward your goals together. Our Portfolio Managers do not receive commissions on trades; our recommendations of investments are based solely on your best interests.
Investments are not a deposit or other obligation of, or guaranteed by, the bank, are not FDIC insured, not insured by any federal government agency, and are subject to investment risks, including possible loss of principal.