Chart of the Day: Mind the 15% Gap
Contents
About the Author

All of our locations will be closed on Monday, October 12, in observance of Columbus Day. Remember, you can bank anytime, anywhere with online and mobile banking.
FDIC-Insured - Backed by the full faith and credit of the U.S. Government
BankFind
This bank is insured by the Federal Deposit Insurance Corporation. The FDIC Certificate ID is 8021. Click on the Certificate ID # to confirm this bank's FDIC coverage using the FDIC's BankFind tool.
EDIE
EDIE lets consumers and bankers know, on a per-bank basis, how the insurance rules and limits apply to a depositor's accounts-what's insured and what portion (if any) exceeds coverage limits at that bank. Check your deposit insurance coverage >>



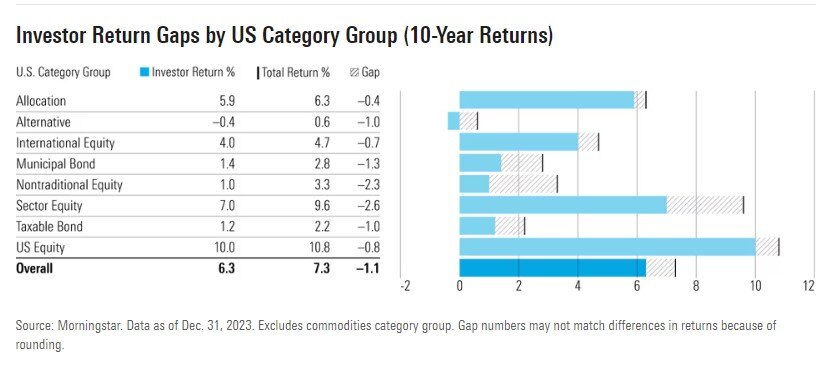
Today’s Chart of the Day is from a Morningstar article named, “Why Investors Missed Out on 15% of Total Funds Returns.” They call it the “gap,” which is comprised of losses experienced by typical investors from excess trading, buying high-flying funds and conversely, selling low-flying ones. Oddly enough, funds that underperform statistically have a better chance to outperform afterwards. This underperformance works out to a 1.1% loss over 10 years resulting in total returns declining from 7.3% to 6.3%, which is a 15% reduction.
Morningstar's suggestion is to use wildly diversified funds and stay away from volatile investments so you don’t have to trade often. Additionally, if saving for something, do it routinely to not try and time the market.
Experienced professionals from our wealth management services team can help you achieve a bright financial future through investment strategies tailored to you. We’ll show you all of the options available and help you choose the ones best suited to you. We’ll provide high-quality, personal service as we work toward your goals together. Our Portfolio Managers do not receive commissions on trades; our recommendations of investments are based solely on your best interests.
Investments are not a deposit or other obligation of, or guaranteed by, the bank, are not FDIC insured, not insured by any federal government agency, and are subject to investment risks, including possible loss of principal.