Chart of the Day: S&P 500 Member Performance
Contents
About the Author

Our new Fort Myers branch is open! Visit us at The Parks Shops at Andrea Lane, 14261 S Tamiami Trail Unit 5.
FDIC-Insured - Backed by the full faith and credit of the U.S. Government
BankFind
This bank is insured by the Federal Deposit Insurance Corporation. The FDIC Certificate ID is 8021. Click on the Certificate ID # to confirm this bank's FDIC coverage using the FDIC's BankFind tool.
EDIE
EDIE lets consumers and bankers know, on a per-bank basis, how the insurance rules and limits apply to a depositor's accounts-what's insured and what portion (if any) exceeds coverage limits at that bank. Check your deposit insurance coverage >>



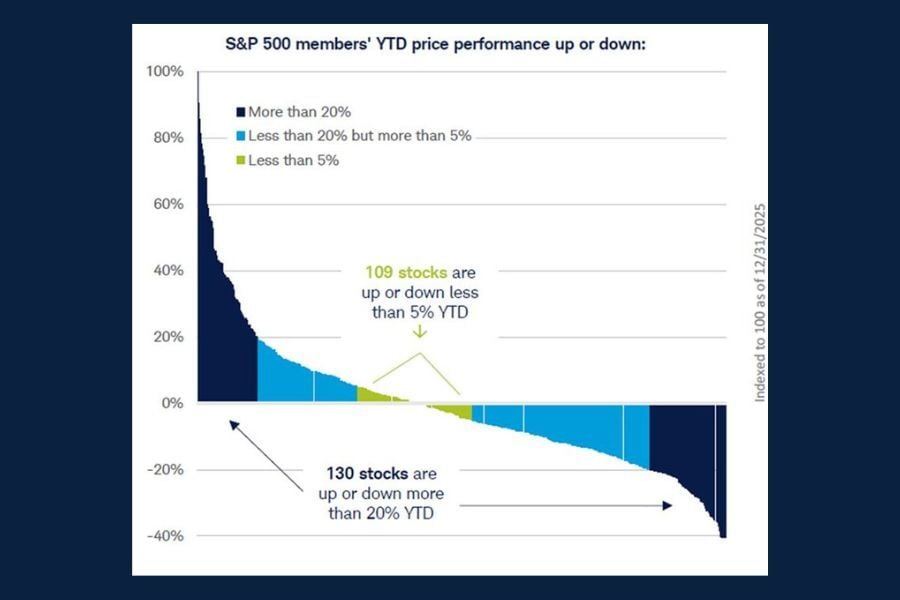
Today’s Chart of the Day from Schwab Market Insights illustrates individual stock performance across all 500 constituents of the S&P 500 index during the first quarter of 2026.
The key takeaway is the sheer breadth of over and under performers. The chart notes that 130 stocks were up or down more than 20% in Q1-2026, and only 109 stocks fell within the moderate range of -5% to 5% returns.
This dispersion is an excellent example of how volatile equity markets can be at times and underscores the risks associated with owning individual stocks. At the same time, the data demonstrates the potential for outsized rewards.
As always, thoughtful allocation and disciplined risk assessment are essential when constructing a portfolio aligned with an investor’s objectives.
John joined Crews Bank & Trust as a Trust Investment Associate in September 2025. He holds a Bachelor of Science in Business Administration with a focus in Finance and Banking from the University of Missouri, along with an Investment Certificate. In his role, he supports portfolio maintenance and analysis while helping clients work toward their financial goals.
Investments are not a deposit or other obligation of, or guaranteed by, the bank, are not FDIC insured, not insured by any federal government agency, and are subject to investment risks, including possible loss of principal. Past performance is not indicative of future results.