Chart of the Day: The Impact of Rebalancing
Contents
About the Author

Take the first step toward securing your legacy. Attend a complimentary estate-planning seminar.
Investment products are not insured by the FDIC, are not deposits, and may lose value.
FDIC-Insured - Backed by the full faith and credit of the U.S. Government
BankFind
This bank is insured by the Federal Deposit Insurance Corporation. The FDIC Certificate ID is 8021. Click on the Certificate ID # to confirm this bank's FDIC coverage using the FDIC's BankFind tool.
EDIE
EDIE lets consumers and bankers know, on a per-bank basis, how the insurance rules and limits apply to a depositor's accounts-what's insured and what portion (if any) exceeds coverage limits at that bank. Check your deposit insurance coverage >>

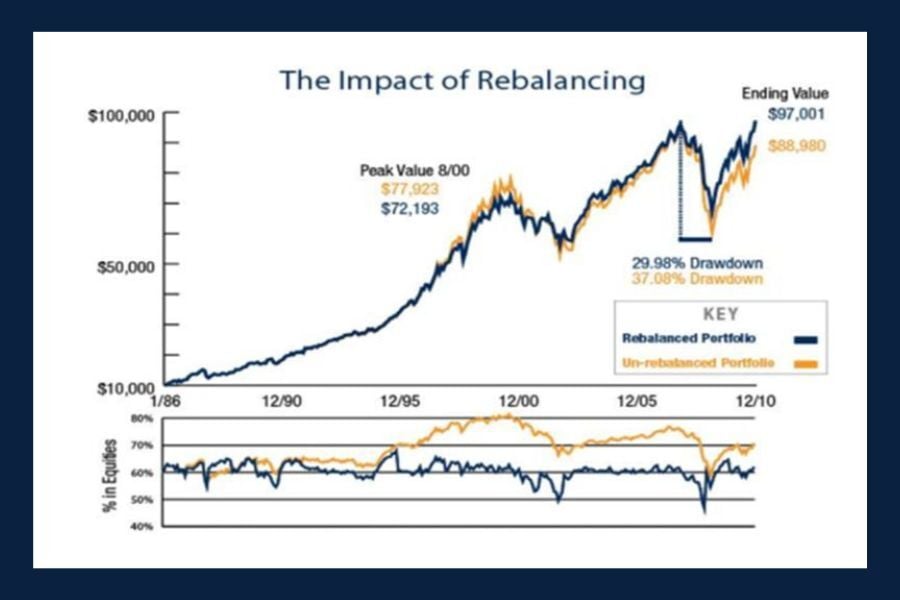
Today’s chart from AllGen Financial’s "Maximizing Investments with a Rebalancing Strategy" illustrates a 25‑year simulation of a 60/40 portfolio to demonstrate the impact of rebalancing over time.
The dark line represents the rebalanced portfolio, while the yellow line reflects the un‑rebalanced approach. The data shows that un‑rebalanced portfolios can experience stronger gains during periods of market exuberance, such as the years leading up to 2000.
However, without periodic rebalancing, portfolios are prone to allocation drift, increasing exposure to equities or fixed income and elevating overall risk. As highlighted in the chart, the un‑rebalanced portfolio suffered significantly greater losses during the Global Financial Crisis, ultimately resulting in underperformance by the end of the period.
By contrast, regular rebalancing allows investors to systematically sell appreciated assets and redeploy capital into areas that may be attractively valued. If executed properly, rebalancing can help manage risk and support optimal performance.
John joined Crews Bank & Trust as a Trust Investment Associate in September 2025. He holds a Bachelor of Science in Business Administration with a focus in Finance and Banking from the University of Missouri, along with an Investment Certificate. In his role, he supports portfolio maintenance and analysis while helping clients work toward their financial goals.
Investments are not a deposit or other obligation of, or guaranteed by, the bank, are not FDIC insured, not insured by any federal government agency, and are subject to investment risks, including possible loss of principal.