Chart of the Day - The Opposite of Shrinkflation
Contents
About the Author

Thinking about your family's future? Attend one of our upcoming Trust Seminars and learn how thoughtful planning can make a lasting difference. Register here.
Investments are not FDIC insured, not deposits, and may lose value.
FDIC-Insured - Backed by the full faith and credit of the U.S. Government
BankFind
This bank is insured by the Federal Deposit Insurance Corporation. The FDIC Certificate ID is 8021. Click on the Certificate ID # to confirm this bank's FDIC coverage using the FDIC's BankFind tool.
EDIE
EDIE lets consumers and bankers know, on a per-bank basis, how the insurance rules and limits apply to a depositor's accounts-what's insured and what portion (if any) exceeds coverage limits at that bank. Check your deposit insurance coverage >>



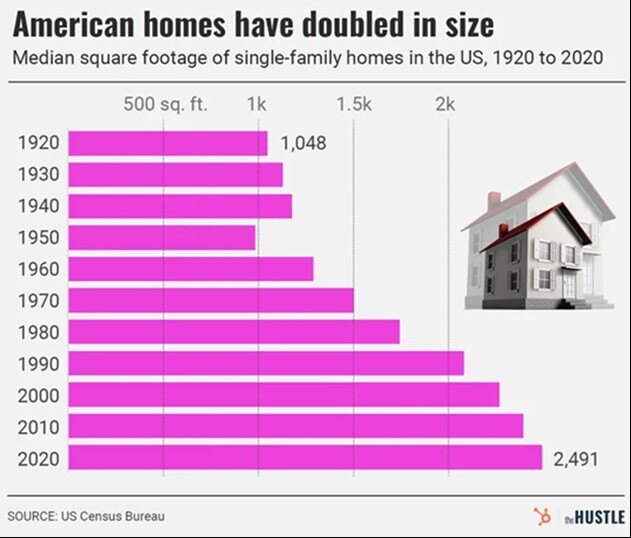
Today’s Chart of the Day is from theHUSTLE with data from the US Census Bureau showing that the median square footage of houses in the US has increased 138%, from 1,048 sq-ft in 1920 to 2,491 in 2020.Since 2000, house prices have been quite volatile, and the indexes show that prices are increasing higher than inflation. However, some of this can be attributed to the fact that houses are simply getting larger, thus they cost more. If the trend continues at this rate, the median house could be over 4,000 sq-ft in the year 2080.
Experienced professionals from our wealth management services team can help you achieve a bright financial future through investment strategies tailored to you. We’ll show you all of the options available and help you choose the ones best suited to you. We’ll provide high-quality, personal service as we work toward your goals together. Our Portfolio Managers do not receive commissions on trades; our recommendations of investments are based solely on your best interests.
Investments are not a deposit or other obligation of, or guaranteed by, the bank, are not FDIC insured, not insured by any federal government agency, and are subject to investment risks, including possible loss of principal.