Chart of the Day: 1988 Home Prices to Now
Contents
About the Author

Take the first step toward securing your legacy. Attend a complimentary estate-planning seminar.
Investment products are not insured by the FDIC, are not deposits, and may lose value.
FDIC-Insured - Backed by the full faith and credit of the U.S. Government
BankFind
This bank is insured by the Federal Deposit Insurance Corporation. The FDIC Certificate ID is 8021. Click on the Certificate ID # to confirm this bank's FDIC coverage using the FDIC's BankFind tool.
EDIE
EDIE lets consumers and bankers know, on a per-bank basis, how the insurance rules and limits apply to a depositor's accounts-what's insured and what portion (if any) exceeds coverage limits at that bank. Check your deposit insurance coverage >>

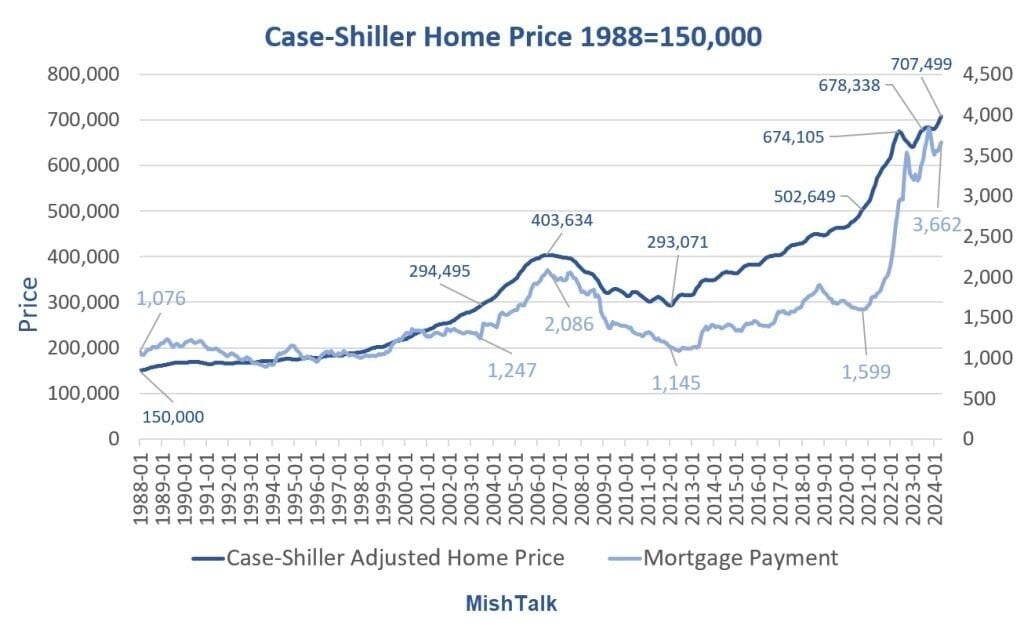
Today’s Chart of the Day is data from Case-Shiller Adjusted Home Price, charted by Mish. The chart shows the increase in home prices based on Fannie Mae 30-year mortgage rates from 1988, when the index began, to today.
In 1988, the average adjusted home price was $150,000. Today the value is $707,000. This results in an annual increase of 4.4%.
The average mortgage payment in 1988 was $1,076 and is now $3,662, an annual increase of 3.5%.
For comparison, inflation over that same time beat both at an annual 4.6%. However, growth of home prices does not put a price on the “utility” (aka benefits) received over that same time, that being a roof over your head and walls to keep you safe.
One can also see from looking at this chart that mortgage payments are back to normal versus the value of homes, and perhaps the anomaly stemmed from the artificially low rates after the Great Recession.
Experienced professionals from our wealth management services team can help you achieve a bright financial future through investment strategies tailored to you. We’ll show you all of the options available and help you choose the ones best suited to you. We’ll provide high-quality, personal service as we work toward your goals together. Our Portfolio Managers do not receive commissions on trades; our recommendations of investments are based solely on your best interests.
Investments are not a deposit or other obligation of, or guaranteed by, the bank, are not FDIC insured, not insured by any federal government agency, and are subject to investment risks, including possible loss of principal.