Chart of the Day: How Today's Expansion Stacks Up
Contents
About the Author

Thinking about your family's future? Attend one of our upcoming Trust Seminars and learn how thoughtful planning can make a lasting difference. Register here.
Investments are not FDIC insured, not deposits, and may lose value.
FDIC-Insured - Backed by the full faith and credit of the U.S. Government
BankFind
This bank is insured by the Federal Deposit Insurance Corporation. The FDIC Certificate ID is 8021. Click on the Certificate ID # to confirm this bank's FDIC coverage using the FDIC's BankFind tool.
EDIE
EDIE lets consumers and bankers know, on a per-bank basis, how the insurance rules and limits apply to a depositor's accounts-what's insured and what portion (if any) exceeds coverage limits at that bank. Check your deposit insurance coverage >>



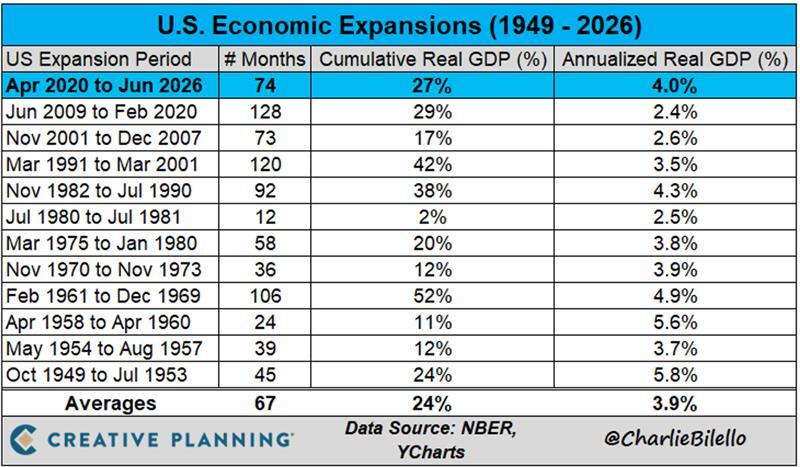
Today’s Chart of the Day from Charlie Bilello's The Week in Charts (9/11/26) highlights expansionary periods within the U.S. supported by positive GDP data. Annualized real GDP of 4% has supported the most recent period from 2020-2026, which has surpassed the historical average in all 3 categories (number of months, cumulative real GDP, annualized real GDP).
John joined Crews Bank & Trust as a Trust Investment Associate in September 2025 and was promoted to Portfolio Manager in 2026. He holds a Bachelor of Science in Business Administration with a focus in Finance and Banking from the University of Missouri, along with an Investment Certificate. In his role, he supports portfolio maintenance and analysis while helping clients work toward their financial goals.
Investments are not a deposit or other obligation of, or guaranteed by, the bank, are not FDIC insured, not insured by any federal government agency, and are subject to investment risks, including possible loss of principal. Past performance is not indicative of future results.