

Chart of the Day: Nvidia Keeps Winning
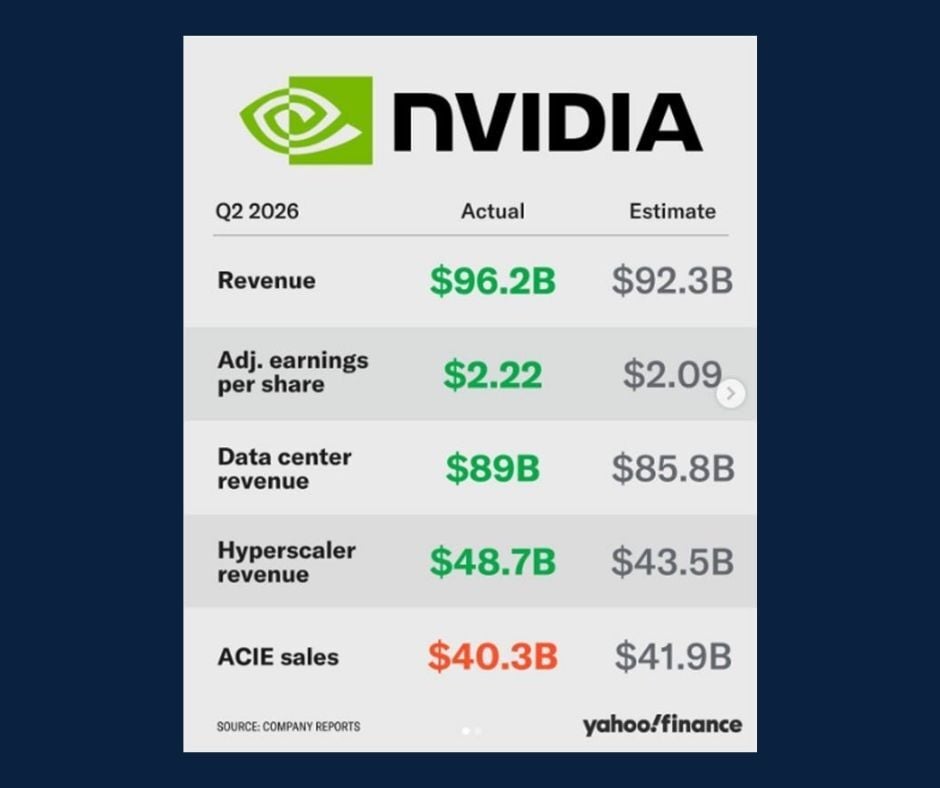
Today’s Chart of the Day from Yahoo Finance on Instagram breaks down Nvidia’s most recent earnings report for Q2 2026.
All of our locations will be closed on Monday, October 12, in observance of Columbus Day. Remember, you can bank anytime, anywhere with online and mobile banking.
FDIC-Insured - Backed by the full faith and credit of the U.S. Government
BankFind
This bank is insured by the Federal Deposit Insurance Corporation. The FDIC Certificate ID is 8021. Click on the Certificate ID # to confirm this bank's FDIC coverage using the FDIC's BankFind tool.
EDIE
EDIE lets consumers and bankers know, on a per-bank basis, how the insurance rules and limits apply to a depositor's accounts-what's insured and what portion (if any) exceeds coverage limits at that bank. Check your deposit insurance coverage >>
Today’s Chart of the Day from Yahoo Finance on Instagram breaks down Nvidia’s most recent earnings report for Q2 2026.
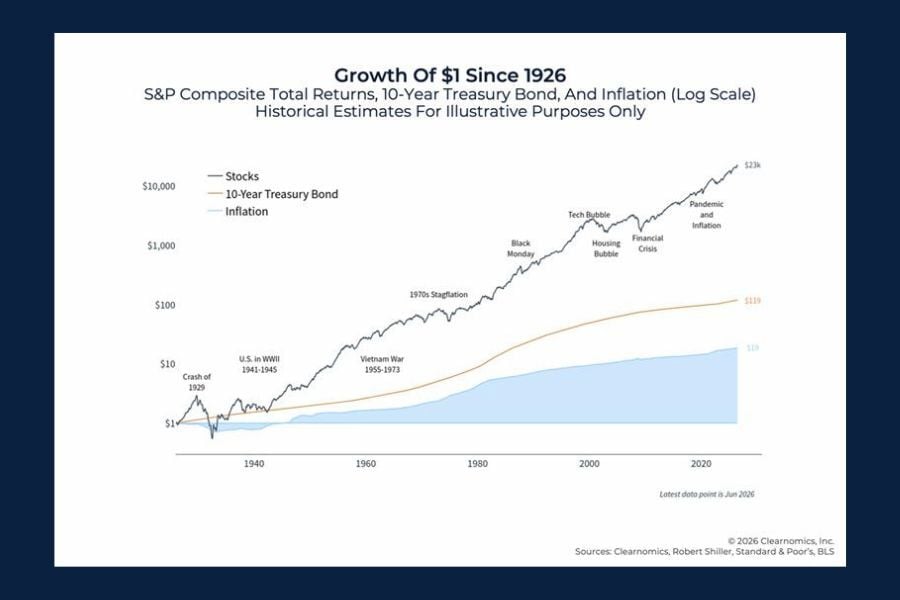
Today's Chart of the Day from Clearnomics' 10 Charts on the 2026 Mid-Year Market Outlook reveals the power of compounding over the past century.
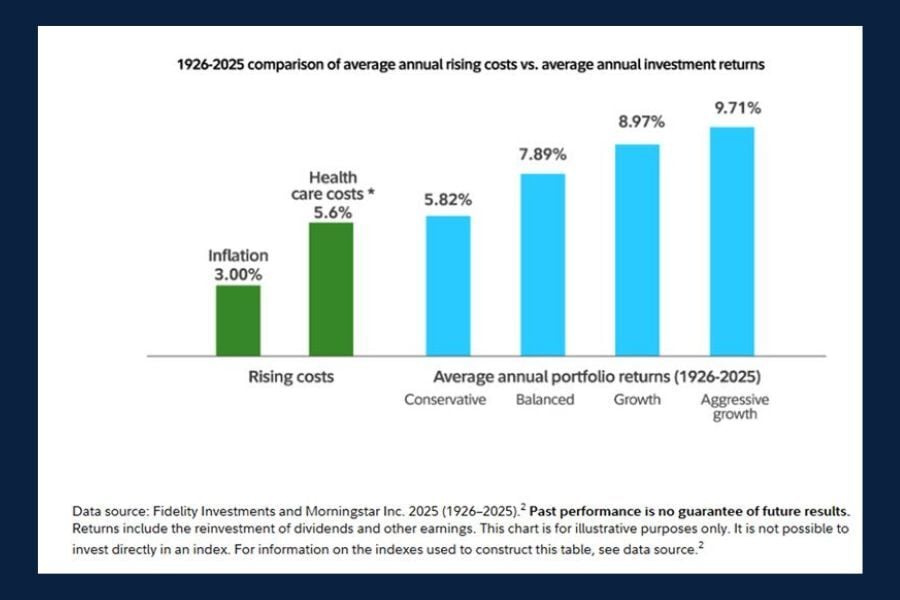
Today’s Chart of the Day from the blog Is $1 million enough to retire? by Fidelity explores a common retirement question: Is $1 million enough? Using..

Today’s Chart of the Day from Schwab Asset Management's blog, Overconfidence bias, highlights a well-known concept in behavioral finance:..
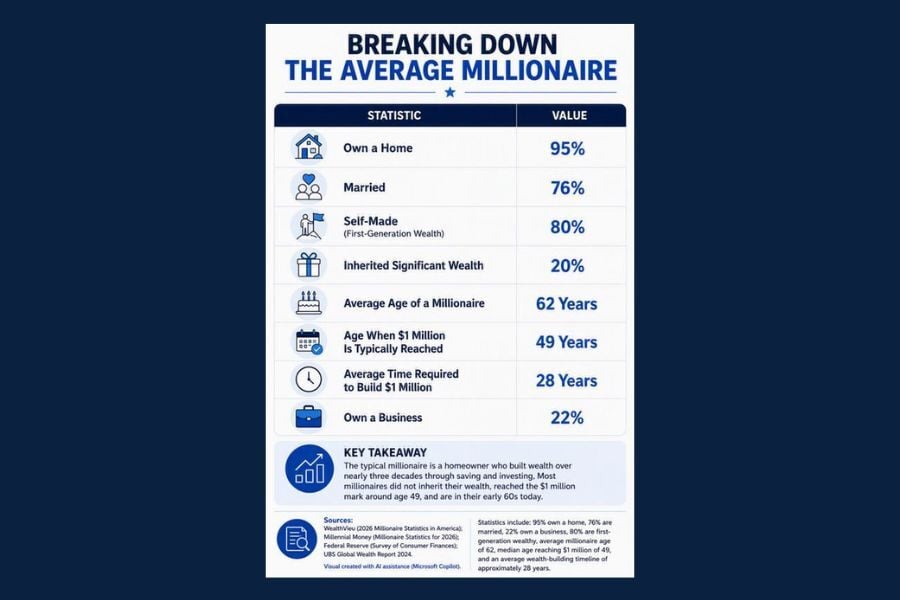
Today’s Chart of the Day pulls data from several sources to show what it really takes to become the average millionaire.
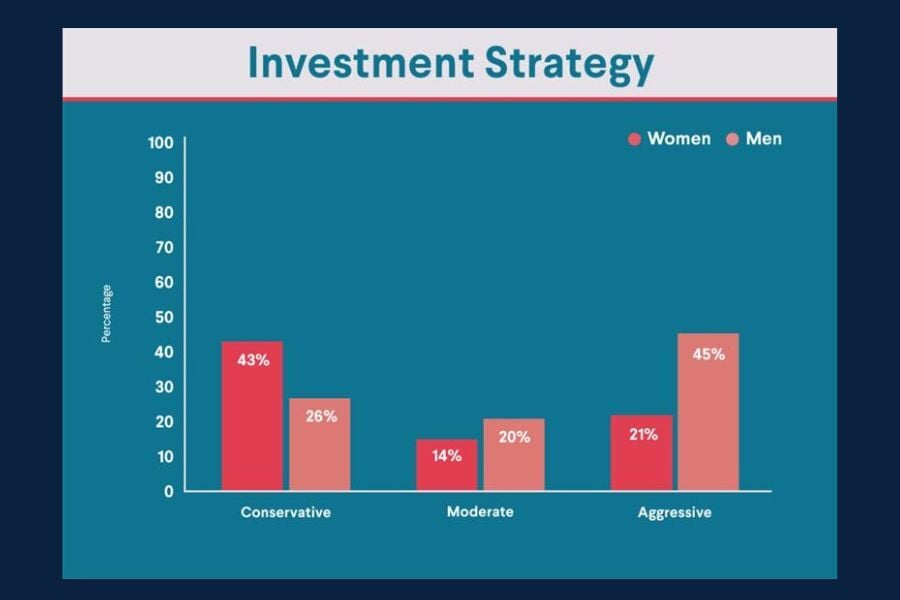
Today’s Chart of the Day from SoFi, Women and Investing: The 2026 Outlook, Strategies & Trend, breaks down the investment tendencies between men and..
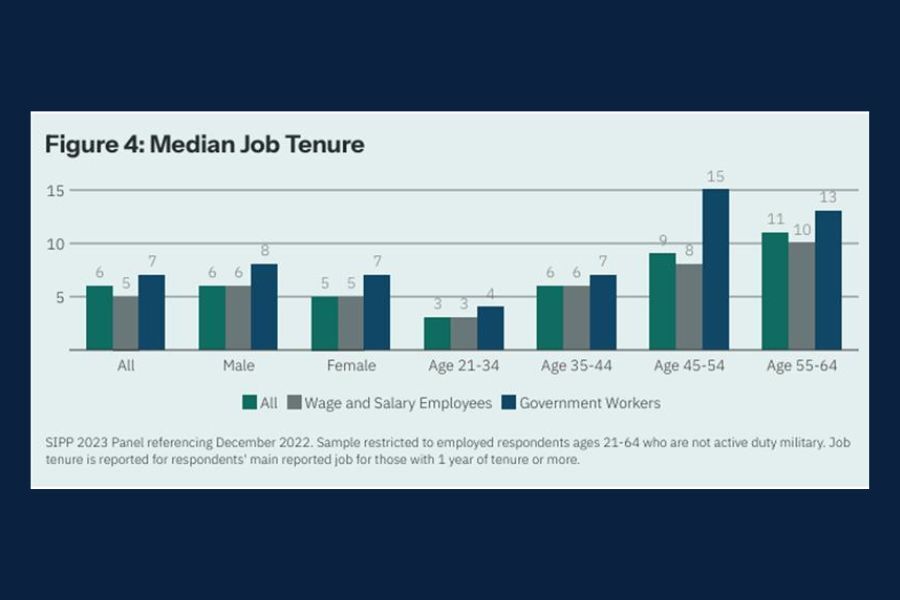
Today’s Chart of the Day, Retirement in America, from NIRS highlights how job tenure varies across age groups and employment sectors. Younger workers..
Today’s Chart of the Day from Statista's, Americans Trust the Savings Account, shows that Americans overwhelmingly favor savings accounts, with 45%..
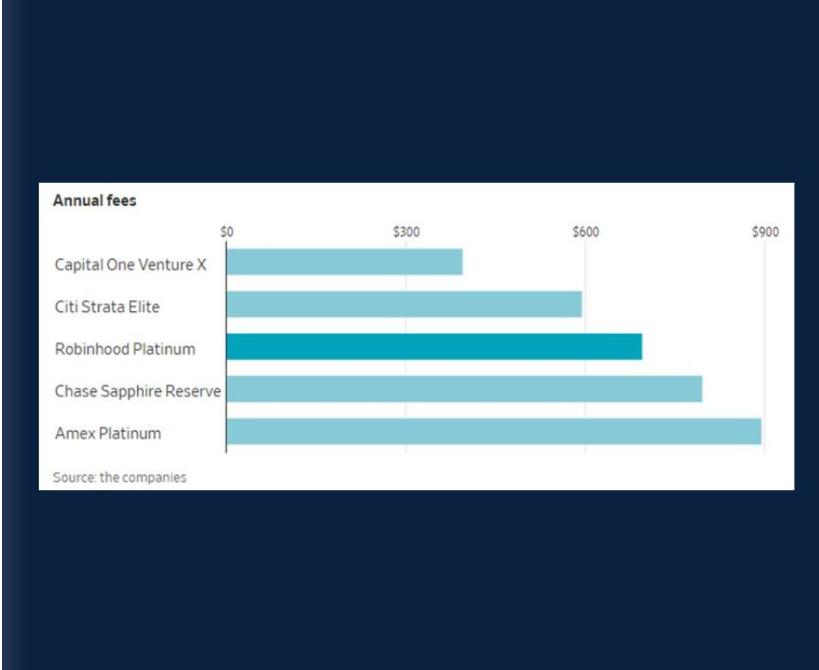
Today's Chart of the Day, featured in The Wall Street Journal article Exclusive | Robinhood Revamps $695 Platinum Card After Customers Take Issue..
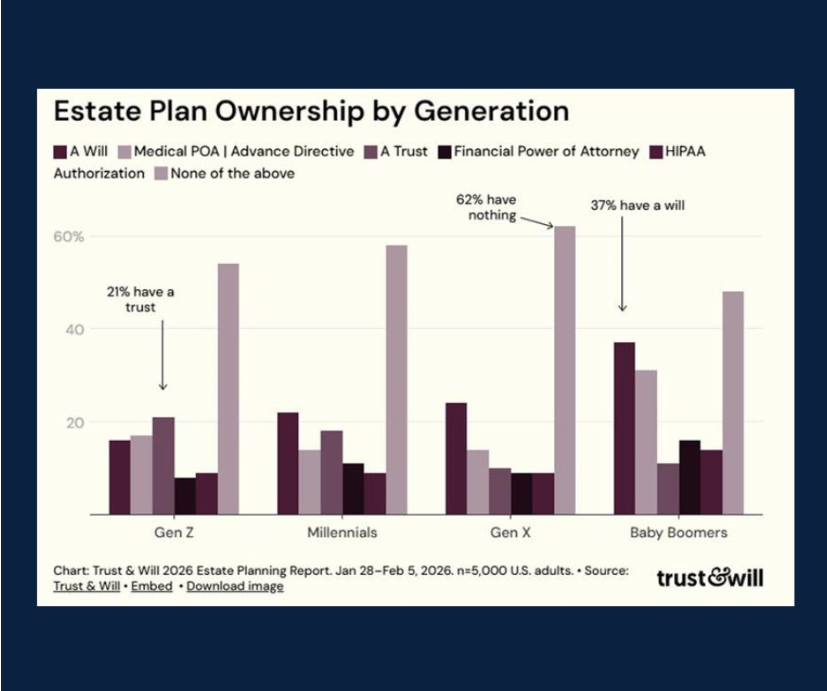
Today’s Chart of the Day comes Trust & Will's 2026 Estate Planning Report: Key Findings and Trends and breaks down estate planning participation..
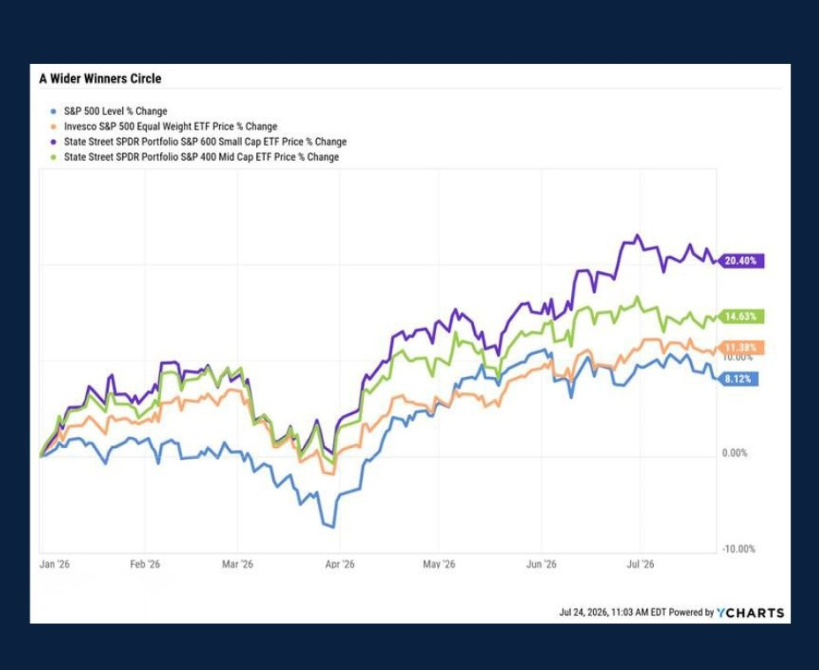
Today’s Chart of the Day created in YCharts with data from Morningstar compares the performance of the S&P 500 with small-cap, mid-cap, and..
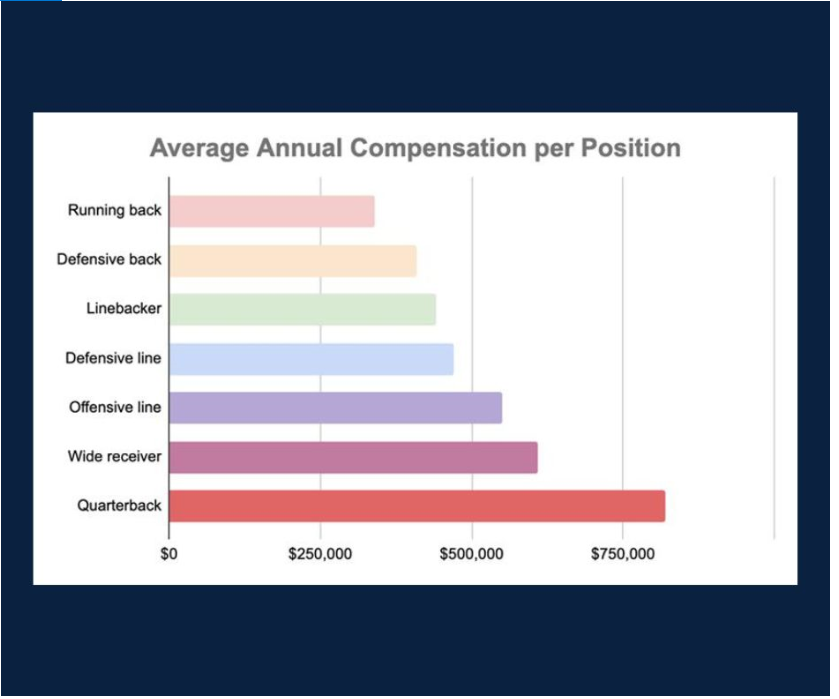
With the return of college football, Saturdays across the country are loud and rowdy yet again. Today’s Chart of the Day from Crystal Capital..
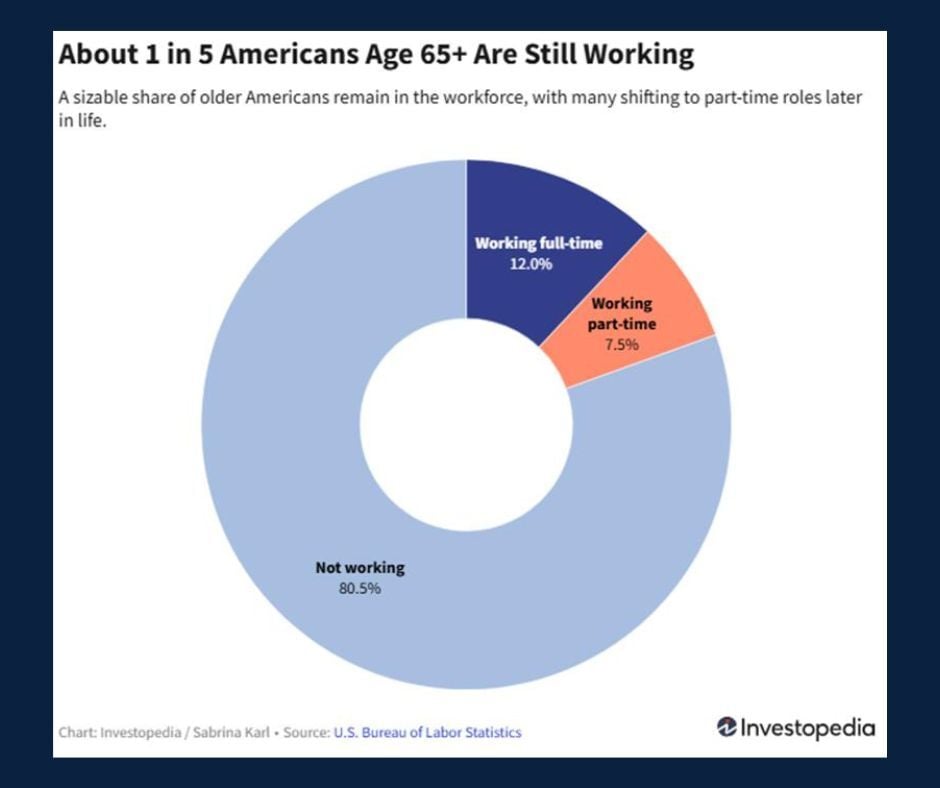
Today’s Chart of the Day from Investopedia's blog How Many Americans Work Past 65? Changing Retirement by the Numbers shows that roughly 20% of..
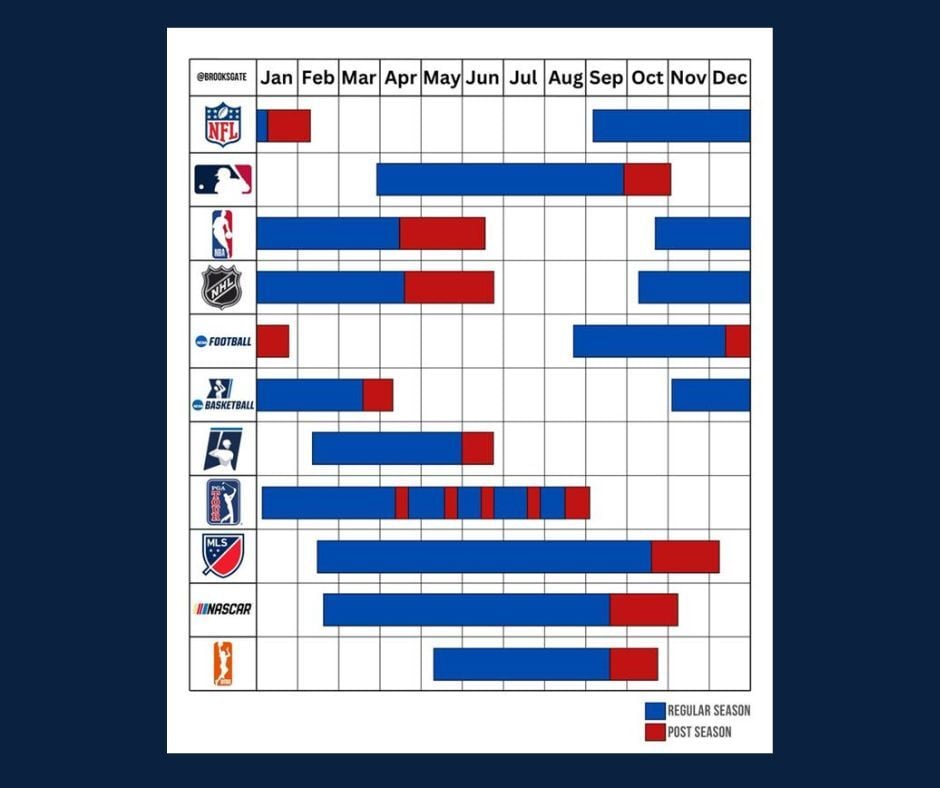
Today’s Chart of the Day from BrooksGate on X: the US sports calendar delivers a year-round snapshot of the calendars for the major U.S. sports..
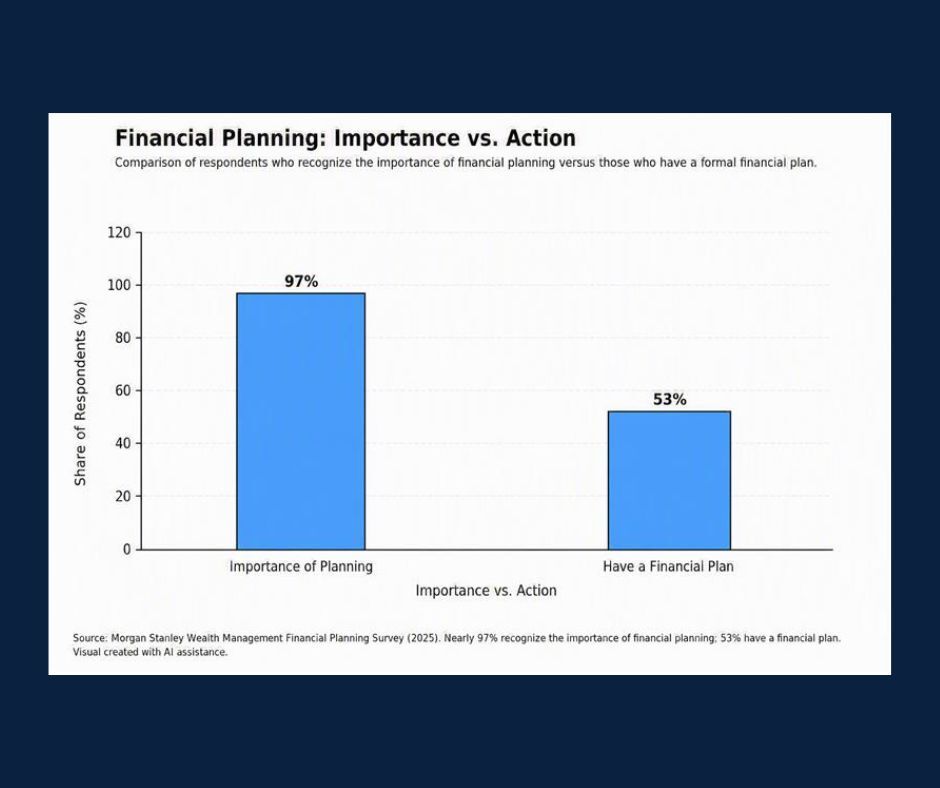
Today's Chart of the Day was created with data from Morgan Stanley’s Financial Planning Survey and gives valuable insight into investor attitudes..
Investments are not a deposit or other obligation of, or guaranteed by, the bank, are not FDIC insured, not insured by any federal government agency, and are subject to investment risks, including possible loss of principal. Past performance is not indicative of future results.
Today’s Chart of the Day from Yahoo Finance on Instagram breaks down Nvidia’s most recent earnings report for Q2 2026.
Today's Chart of the Day from Clearnomics' 10 Charts on the 2026 Mid-Year Market Outlook reveals the power of compounding over the past century.
Today’s Chart of the Day from the blog Is $1 million enough to retire? by Fidelity explores a common retirement question: Is $1 million enough? Using historical market performance and portfolio allocations compared to inflation and rising health care costs, the answer may vary.
Today’s Chart of the Day from Schwab Asset Management's blog, Overconfidence bias, highlights a well-known concept in behavioral finance: overconfidence bias, or our tendency to think we’re better at things than we actually are.
Today’s Chart of the Day pulls data from several sources to show what it really takes to become the average millionaire.
Today’s Chart of the Day from SoFi, Women and Investing: The 2026 Outlook, Strategies & Trend, breaks down the investment tendencies between men and women.
Today’s Chart of the Day, Retirement in America, from NIRS highlights how job tenure varies across age groups and employment sectors. Younger workers tend to have shorter job tenure, while older workers, especially in government positions, typically remain with the same employer longer.
Today’s Chart of the Day from Statista's, Americans Trust the Savings Account, shows that Americans overwhelmingly favor savings accounts, with 45% of respondents reporting that they own or use one. Their popularity likely comes down to simplicity, safety, and easy access to cash when needed.
Today's Chart of the Day, featured in The Wall Street Journal article Exclusive | Robinhood Revamps $695 Platinum Card After Customers Take Issue With Perks compares annual fees for some of the most popular premium credit cards.
Today’s Chart of the Day comes Trust & Will's 2026 Estate Planning Report: Key Findings and Trends and breaks down estate planning participation across generations, revealing some surprising results.
Today’s Chart of the Day created in YCharts with data from Morningstar compares the performance of the S&P 500 with small-cap, mid-cap, and equal-weighted indexes through July. After leading the market for several years, the S&P 500 has taken a back seat in 2026. That’s not a knock on its performance, as an 8% gain is still in line with its long-term average, but rather a reflection of the strong returns coming from smaller companies.
With the return of college football, Saturdays across the country are loud and rowdy yet again. Today’s Chart of the Day from Crystal Capital Partners' blog NIL College Football Poised for a $2.5 Billion Valuation highlights the average NIL (Name, Image and Likeness) compensation across different positions on the turf.
Today’s Chart of the Day from Investopedia's blog How Many Americans Work Past 65? Changing Retirement by the Numbers shows that roughly 20% of American’s Americans aged 65+ years remain in the workforce.
Today’s Chart of the Day from BrooksGate on X: the US sports calendar delivers a year-round snapshot of the calendars for the major U.S. sports leagues, including the NFL, MLB, NBA, NHL, college football, college basketball, college baseball, PGA Tour, MLS, NASCAR and WNBA.
Today's Chart of the Day was created with data from Morgan Stanley’s Financial Planning Survey and gives valuable insight into investor attitudes toward comprehensive financial planning.
current_page_num+2: 3 -