Chart of the Day: Interest Rate Cycle
Contents
About the Author

All of our locations will be closed on Monday, October 12, in observance of Columbus Day. Remember, you can bank anytime, anywhere with online and mobile banking.
FDIC-Insured - Backed by the full faith and credit of the U.S. Government
BankFind
This bank is insured by the Federal Deposit Insurance Corporation. The FDIC Certificate ID is 8021. Click on the Certificate ID # to confirm this bank's FDIC coverage using the FDIC's BankFind tool.
EDIE
EDIE lets consumers and bankers know, on a per-bank basis, how the insurance rules and limits apply to a depositor's accounts-what's insured and what portion (if any) exceeds coverage limits at that bank. Check your deposit insurance coverage >>



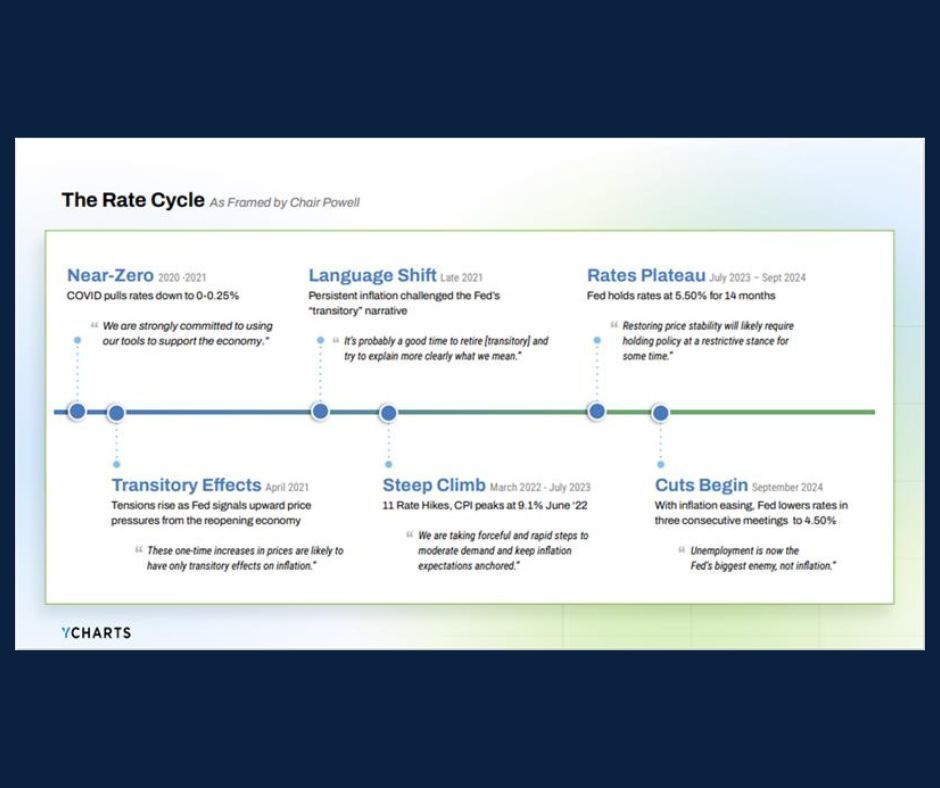
With the current Federal Reserve Chair’s term set to conclude this May, today's Chart of the Day from YCharts looks back at the interest‑rate cycle during his tenure.
The chart captures the shifts in policy, beginning with near‑zero rates during the pandemic as the Fed worked to stabilize the economy.
As inflation accelerated in the following years, rates were raised to cool demand and help stabilize price pressures. With inflation easing thereafter, the Fed pivoted toward gradual rate cuts and a renewed focus on balancing price stability with concerns around employment.
The Federal Reserve plays a crucial role in maintaining economic stability, and interest rate policy will continue to influence the overall financial market.
Gregory is an experienced financial manager specializing in investment holdings for individuals, trusts, IRAs, private foundations, and nonprofit organizations across Florida. A Mercy College graduate with a degree in government, he began his career in technology before transitioning to financial management in 2009.
Investments are not a deposit or other obligation of, or guaranteed by, the bank, are not FDIC insured, not insured by any federal government agency, and are subject to investment risks, including possible loss of principal.