Chart of the Day: Investing in Gold
Contents
About the Author

All of our locations will be closed on Saturday, July 4, in celebration of Independence Day.
Take the first step toward securing your legacy. Attend a complimentary estate-planning seminar.
Investment products are not insured by the FDIC, are not deposits, and may lose value.
FDIC-Insured - Backed by the full faith and credit of the U.S. Government
BankFind
This bank is insured by the Federal Deposit Insurance Corporation. The FDIC Certificate ID is 8021. Click on the Certificate ID # to confirm this bank's FDIC coverage using the FDIC's BankFind tool.
EDIE
EDIE lets consumers and bankers know, on a per-bank basis, how the insurance rules and limits apply to a depositor's accounts-what's insured and what portion (if any) exceeds coverage limits at that bank. Check your deposit insurance coverage >>

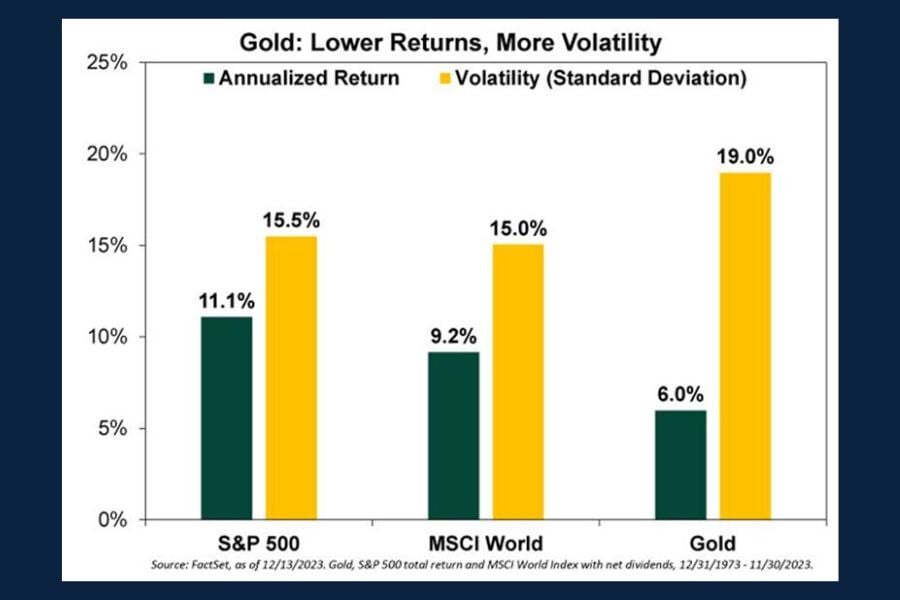
Today's Chart of the Day from the New York Post article "Bullish or Bearish on Bullion? How to think about gold investing in 2024" shows the risk-reward tradeoff of gold compared to other asset classes.
While gold is often viewed as a "stable" haven, the data shows it has actually been more volatile than both U.S. stocks and international securities. Even more surprising, gold investors historically haven't been rewarded for taking on that added risk, with annualized returns of just 6% over the 50-year period starting in 1973.
This chart is a reminder of how important it is for investors to always assess price volatility, stay well diversified, and weigh long-term risk and return expectations rather than relying on assumptions about "safe" investments.
John joined Crews Bank & Trust as a Trust Investment Associate in September 2025. He holds a Bachelor of Science in Business Administration with a focus in Finance and Banking from the University of Missouri, along with an Investment Certificate. In his role, he supports portfolio maintenance and analysis while helping clients work toward their financial goals.
Investments are not a deposit or other obligation of, or guaranteed by, the bank, are not FDIC insured, not insured by any federal government agency, and are subject to investment risks, including possible loss of principal.