Chart of the Day: Life Satisfaction Over Time
Contents
About the Author

Take the first step toward securing your legacy. Attend a complimentary estate-planning seminar.
Investment products are not insured by the FDIC, are not deposits, and may lose value.
FDIC-Insured - Backed by the full faith and credit of the U.S. Government
BankFind
This bank is insured by the Federal Deposit Insurance Corporation. The FDIC Certificate ID is 8021. Click on the Certificate ID # to confirm this bank's FDIC coverage using the FDIC's BankFind tool.
EDIE
EDIE lets consumers and bankers know, on a per-bank basis, how the insurance rules and limits apply to a depositor's accounts-what's insured and what portion (if any) exceeds coverage limits at that bank. Check your deposit insurance coverage >>

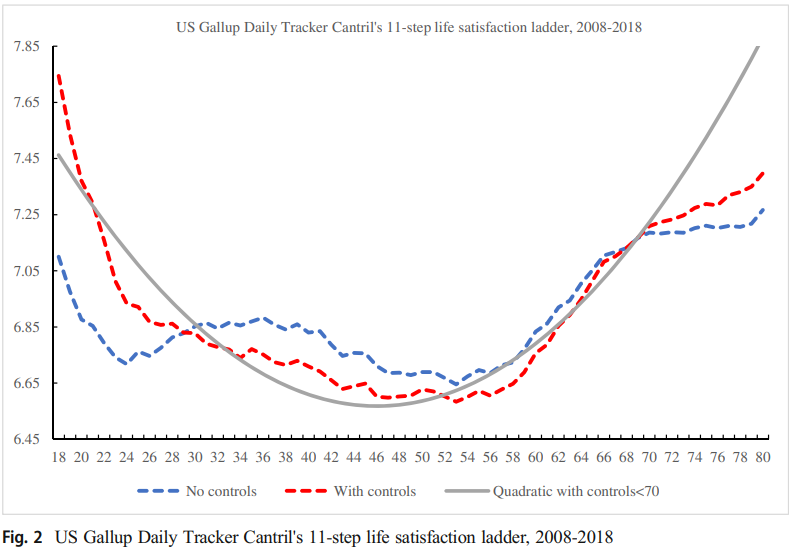
Today’s Chart of the Day is from an article discussed in "A Wealth of Common Sense" by Ben Carlson with data from a research paper by David Blanchflower. The data shows the level of happiness someone experiences according to their age. Notably, it is highest in the 20s, then steadily declines until the low at age 48, which is probably where the “mid-life crisis” theory comes from. It is level again until the mid 50’s and starts to climb back up until age 70.
The article notes the uptrend from middle to older age is when we tend to become wiser, more grateful, and we start to focus on positive aspects of life, rather than the regrets and disappointments.
Experienced professionals from our wealth management services team can help you achieve a bright financial future through investment strategies tailored to you. We’ll show you all of the options available and help you choose the ones best suited to you. We’ll provide high-quality, personal service as we work toward your goals together. Our Portfolio Managers do not receive commissions on trades; our recommendations of investments are based solely on your best interests.
Investments are not a deposit or other obligation of, or guaranteed by, the bank, are not FDIC insured, not insured by any federal government agency, and are subject to investment risks, including possible loss of principal.