Chart of the Day: Lifespan vs. Healthspan
Contents
About the Author

FDIC-Insured - Backed by the full faith and credit of the U.S. Government
BankFind
This bank is insured by the Federal Deposit Insurance Corporation. The FDIC Certificate ID is 8021. Click on the Certificate ID # to confirm this bank's FDIC coverage using the FDIC's BankFind tool.
EDIE
EDIE lets consumers and bankers know, on a per-bank basis, how the insurance rules and limits apply to a depositor's accounts-what's insured and what portion (if any) exceeds coverage limits at that bank. Check your deposit insurance coverage >>

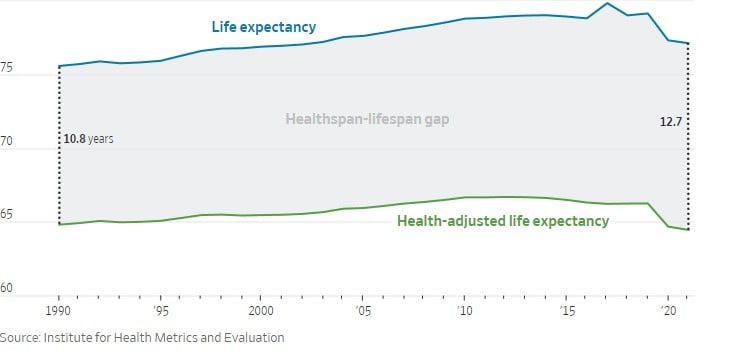
Today’s Chart of the Day is from A Teachable Moment by Tony Isola and one to keep in the back of your mind. In financial planning, we talk about both average lifespan and healthspan, which is the time in your life during which you still feel good, are active, and are free from disability and disease. According to the Institute for Health, this is up to age 65 and has not changed since 1990. However, due to medical advances, the gap between the two has increased from 10.8 years to 12.7 years as life expectancy has increased from 75 to 77 years.
Experienced professionals from our wealth management services team can help you achieve a bright financial future through investment strategies tailored to you. We’ll show you all of the options available and help you choose the ones best suited to you. We’ll provide high-quality, personal service as we work toward your goals together. Our Portfolio Managers do not receive commissions on trades; our recommendations of investments are based solely on your best interests.
Investments are not a deposit or other obligation of, or guaranteed by, the bank, are not FDIC insured, not insured by any federal government agency, and are subject to investment risks, including possible loss of principal.