Chart of the Day: % of Debt Per GDP
Contents
About the Author

All of our locations will be closed on Saturday, July 4, in celebration of Independence Day.
Take the first step toward securing your legacy. Attend a complimentary estate-planning seminar.
Investment products are not insured by the FDIC, are not deposits, and may lose value.
FDIC-Insured - Backed by the full faith and credit of the U.S. Government
BankFind
This bank is insured by the Federal Deposit Insurance Corporation. The FDIC Certificate ID is 8021. Click on the Certificate ID # to confirm this bank's FDIC coverage using the FDIC's BankFind tool.
EDIE
EDIE lets consumers and bankers know, on a per-bank basis, how the insurance rules and limits apply to a depositor's accounts-what's insured and what portion (if any) exceeds coverage limits at that bank. Check your deposit insurance coverage >>

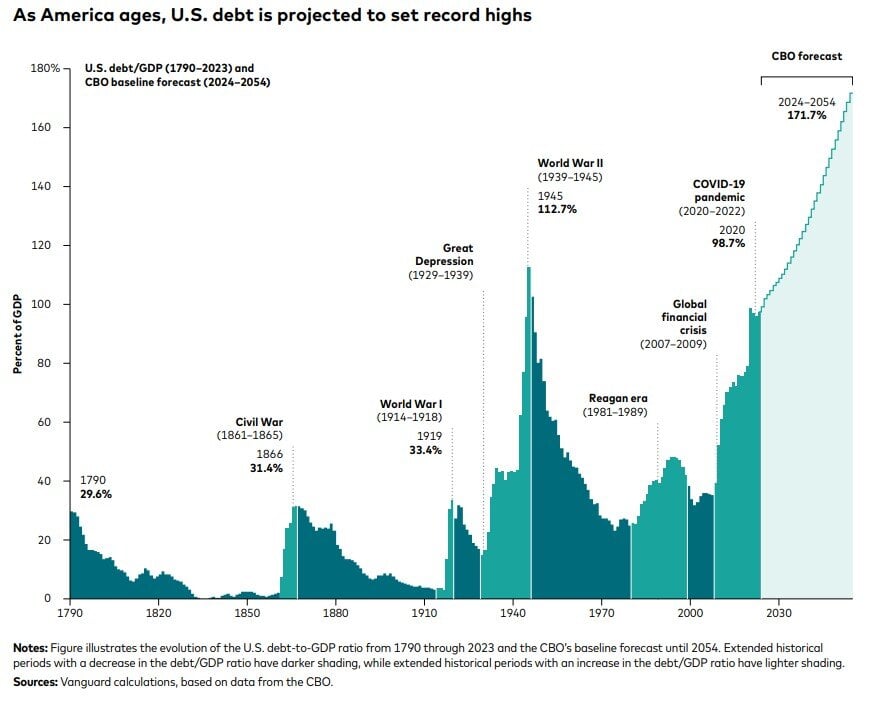
Today’s Chart of the Day from Vanguard shows the US debt as a percentage of GDP (Gross Domestic Product), which is a measure of all the goods and services generated by the United States.This gives some context as the dollar today in proportion to the size of our economy is different than 20 or 40 years ago. Note that the US started printing money after the Great Recession in 2007 and never stopped. We then stepped on the gas during COVID-19. Unfortunately, the levels are now “in the budget” and unless something changes the trajectory is nothing but up. As with all things, we need to keep an eye on because it can’t stay on this path forever.
Experienced professionals from our wealth management services team can help you achieve a bright financial future through investment strategies tailored to you. We’ll show you all of the options available and help you choose the ones best suited to you. We’ll provide high-quality, personal service as we work toward your goals together. Our Portfolio Managers do not receive commissions on trades; our recommendations of investments are based solely on your best interests.
Investments are not a deposit or other obligation of, or guaranteed by, the bank, are not FDIC insured, not insured by any federal government agency, and are subject to investment risks, including possible loss of principal.