Chart of the Day: S&P By Decade
Contents
About the Author

Our new Fort Myers branch is open! Visit us at The Parks Shops at Andrea Lane, 14261 S Tamiami Trail Unit 5.
FDIC-Insured - Backed by the full faith and credit of the U.S. Government
BankFind
This bank is insured by the Federal Deposit Insurance Corporation. The FDIC Certificate ID is 8021. Click on the Certificate ID # to confirm this bank's FDIC coverage using the FDIC's BankFind tool.
EDIE
EDIE lets consumers and bankers know, on a per-bank basis, how the insurance rules and limits apply to a depositor's accounts-what's insured and what portion (if any) exceeds coverage limits at that bank. Check your deposit insurance coverage >>



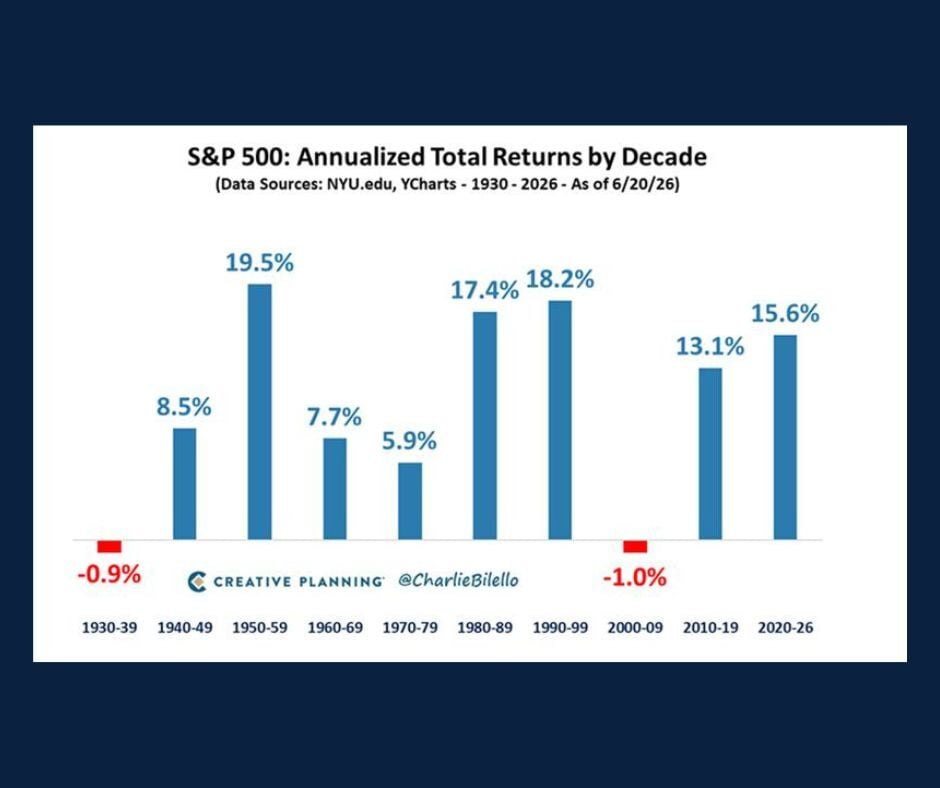
Today's Chart of the Day from Charlie Bilello’s blog, "The Week in Charts," from June 24, 2026, examines the S&P 500's performance by decade, with returns dating back to the 1930s.
Half of the decades delivered annualized returns well above the market’s historical average of roughly 10%. Notably, only two decades produced negative annualized returns.
Despite encompassing some of the most challenging periods in market history (including the Great Depression in the 1930s and the combined effects of the dotcom bust and Global Financial Crisis in the 2000s) those negative decades resulted in only modest annualized losses.
While market downturns can feel significant in the moment, a decade provides ample time for compounding to work and for markets to recover from even severe drawdowns. It's easy to overestimate what can happen in a single year and underestimate what can be achieved over the course of 10.
John joined Crews Bank & Trust as a Trust Investment Associate in September 2025. He holds a Bachelor of Science in Business Administration with a focus in Finance and Banking from the University of Missouri, along with an Investment Certificate. In his role, he supports portfolio maintenance and analysis while helping clients work toward their financial goals.
Investments are not a deposit or other obligation of, or guaranteed by, the bank, are not FDIC insured, not insured by any federal government agency, and are subject to investment risks, including possible loss of principal. Past performance is not indicative of future results.