Record Real Estate Prices
Contents
About the Author

Small business? Turn your phone into an on-the-go card reader with Tap2Local.
FDIC-Insured - Backed by the full faith and credit of the U.S. Government
BankFind
This bank is insured by the Federal Deposit Insurance Corporation. The FDIC Certificate ID is 8021. Click on the Certificate ID # to confirm this bank's FDIC coverage using the FDIC's BankFind tool.
EDIE
EDIE lets consumers and bankers know, on a per-bank basis, how the insurance rules and limits apply to a depositor's accounts-what's insured and what portion (if any) exceeds coverage limits at that bank. Check your deposit insurance coverage >>

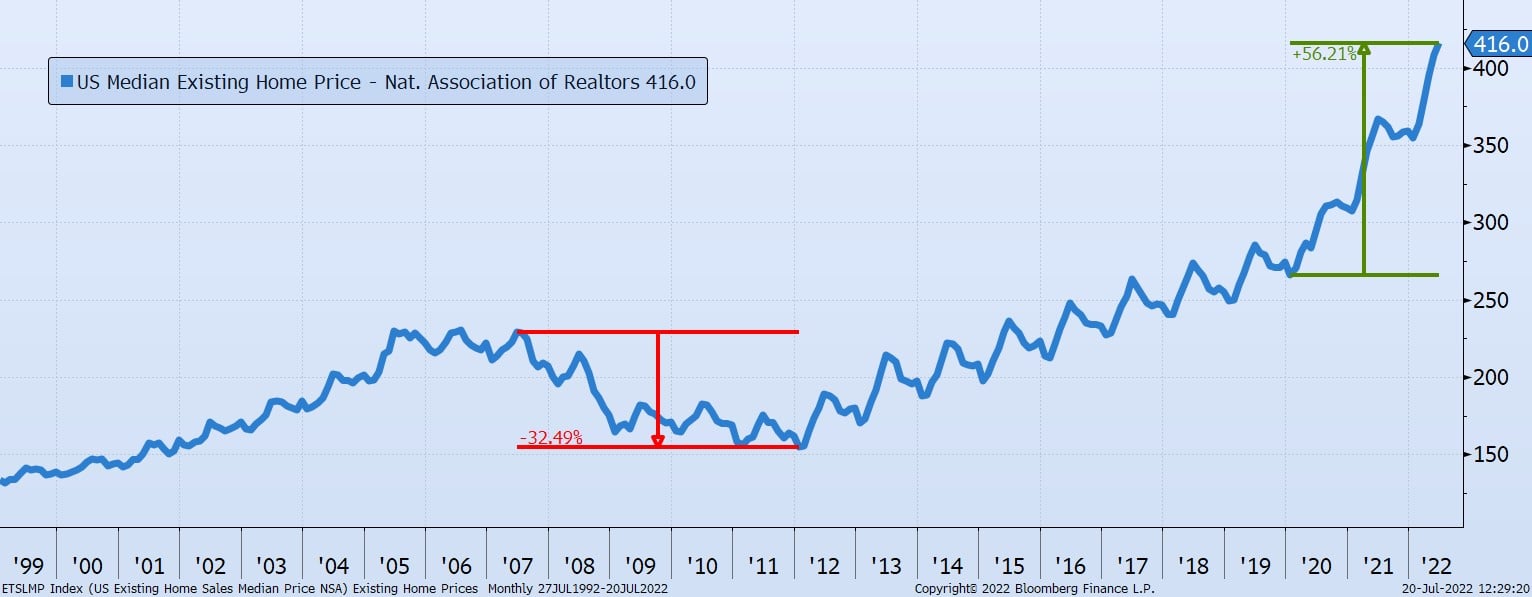
Today's Chart of the Day is a Bloomberg chart of the U.S. Median Existing Home Price provided by the National Association of Realtors going all the way back to 1999.
The Wall Street Journal reported that even though sales fell 14% last year, the average home stayed on the market an incredibly short 14 days. This is the fewest amount of days since 2011, even with the current price increase to a record $416,000. This price is a 56% increase from the $266,000 just before COVID-19 in January 2020. This was all supposedly fueled by a lack of inventory in the housing market.
The past is not a predictor of the future, and the world was a different place back then, but there are still scars from The Great Recession. This is highlighted by the 4.5-year span from the peak in 2007 to the low in 2012 where home prices dropped 33%.
Experienced professionals from our wealth management services team can help you achieve a bright financial future through investment strategies tailored to you. We’ll show you all of the options available and help you choose the ones best suited to you. We’ll provide high-quality, personal service as we work toward your goals together. Our Portfolio Managers do not receive commissions on trades; our recommendations of investments are based solely on your best interests.
Investments are not a deposit or other obligation of, or guaranteed by, the bank, are not FDIC insured, not insured by any federal government agency, and are subject to investment risks, including possible loss of principal.