Chart of the Day: U.S. Home Sales
Contents
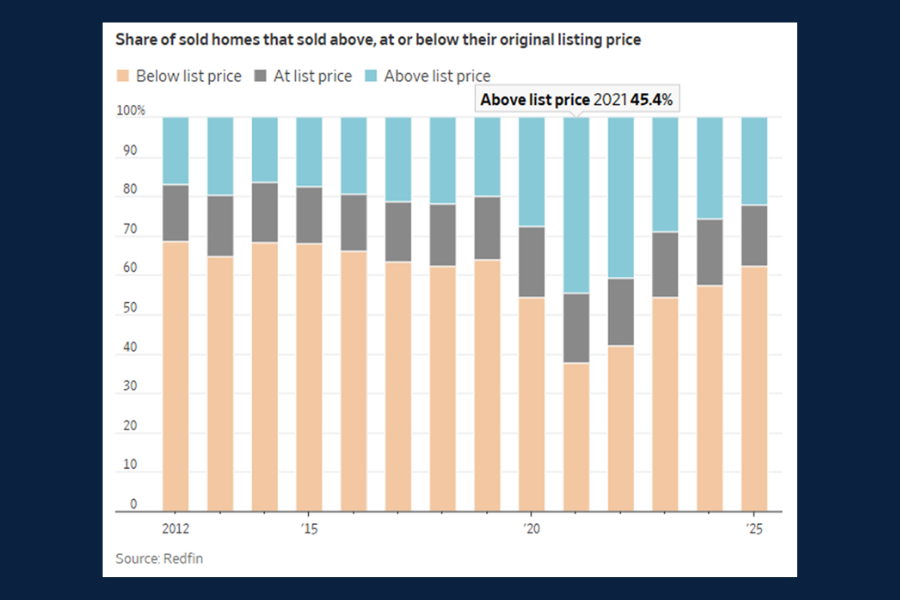
Today's Chart of the Day is actually two charts from The Wall Street Journal article “The Housing Market Is Swinging Toward Buyers.” The article illustrates the multi‑year shift in U.S. home‑sale pricing dynamics.
In 2021, intense competition and limited inventory fueled widespread bidding wars, pushing the share of homes sold above list price to a peak of roughly 45%.
During that same period, the typical discount on homes sold below list price narrowed, reflecting sellers’ stronger negotiating power.

Since then, as supply has gradually realigned with demand, pricing behavior has moved back toward historical norms. Today, the market increasingly favors buyers: nearly 60% of homes are selling below asking, and the average discount has widened to about 7.9%, the highest level in years. Together, the charts demonstrate how the balance of power has shifted—marking a return to a more typical, buyer‑friendly environment.
About the Author