Chart of the Day: Growth of $1
Contents
About the Author

Buying a home? Check out our great rates. Terms and conditions apply. Loans subject to credit approval. NMLS #406389
FDIC-Insured - Backed by the full faith and credit of the U.S. Government
BankFind
This bank is insured by the Federal Deposit Insurance Corporation. The FDIC Certificate ID is 8021. Click on the Certificate ID # to confirm this bank's FDIC coverage using the FDIC's BankFind tool.
EDIE
EDIE lets consumers and bankers know, on a per-bank basis, how the insurance rules and limits apply to a depositor's accounts-what's insured and what portion (if any) exceeds coverage limits at that bank. Check your deposit insurance coverage >>



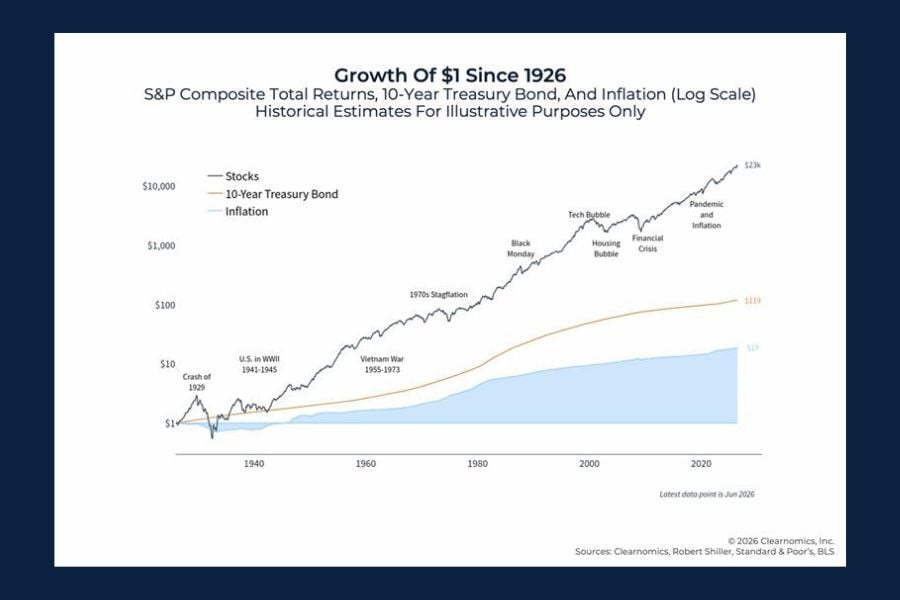
Today's Chart of the Day from Clearnomics' 10 Charts on the 2026 Mid-Year Market Outlook reveals the power of compounding over the past century.
Despite market crashes, recessions, wars, and plenty of reasons to worry along the way, $1 invested in stocks grew to about $23,000 during this timeframe. Bonds helped investors stay ahead of inflation, but stocks were the real engine of growth. So next time the news gets noisy, the best move might be to simply zoom out.
John joined Crews Bank & Trust as a Trust Investment Associate in September 2025 and was promoted to Portfolio Manager in 2026. He holds a Bachelor of Science in Business Administration with a focus in Finance and Banking from the University of Missouri, along with an Investment Certificate. In his role, he supports portfolio maintenance and analysis while helping clients work toward their financial goals.
Investments are not a deposit or other obligation of, or guaranteed by, the bank, are not FDIC insured, not insured by any federal government agency, and are subject to investment risks, including possible loss of principal. Past performance is not indicative of future results.