Chart of the Day: IPO Returns - Post IPO
Contents
About the Author

All of our locations will be closed on Saturday, July 4, in celebration of Independence Day.
Take the first step toward securing your legacy. Attend a complimentary estate-planning seminar.
Investment products are not insured by the FDIC, are not deposits, and may lose value.
FDIC-Insured - Backed by the full faith and credit of the U.S. Government
BankFind
This bank is insured by the Federal Deposit Insurance Corporation. The FDIC Certificate ID is 8021. Click on the Certificate ID # to confirm this bank's FDIC coverage using the FDIC's BankFind tool.
EDIE
EDIE lets consumers and bankers know, on a per-bank basis, how the insurance rules and limits apply to a depositor's accounts-what's insured and what portion (if any) exceeds coverage limits at that bank. Check your deposit insurance coverage >>

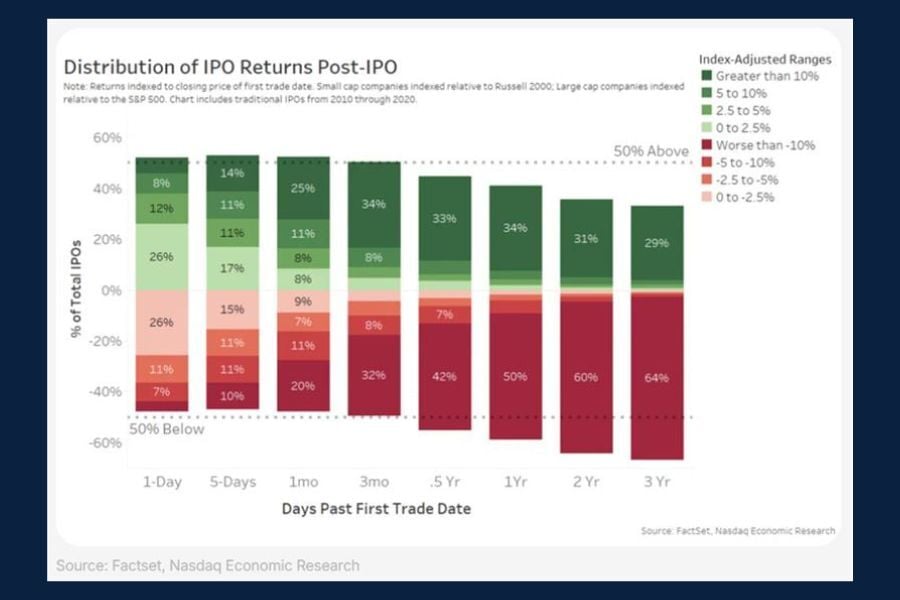
Today’s Chart of the Day, found in arvy weekly's "The IPO Class of 2026" illustrates how stocks have historically performed following an IPO, or initial public offering.
While IPOs often generate excitement, many newly public companies tend to underperform their broader market benchmarks in the following years. This becomes apparent as early as six months post‑IPO.
Benjamin Graham, the father of value investing and author of The Intelligent Investor, was a well‑known IPO skeptic, arguing that new issues are frequently overpriced due to optimistic narratives and underwriter incentives.
IPOs often come to market during favorable conditions, supported by recent growth and strong sentiment, while investment banks have a vested interest in higher offering prices. As a result, IPOs can become more of a marketing exercise than a reflection of intrinsic value, underscoring the importance of evaluating fundamentals and allowing time for meaningful performance data to emerge.
John joined Crews Bank & Trust as a Trust Investment Associate in September 2025. He holds a Bachelor of Science in Business Administration with a focus in Finance and Banking from the University of Missouri, along with an Investment Certificate. In his role, he supports portfolio maintenance and analysis while helping clients work toward their financial goals.
Investments are not a deposit or other obligation of, or guaranteed by, the bank, are not FDIC insured, not insured by any federal government agency, and are subject to investment risks, including possible loss of principal.