Chart of the Day: Names/Times of Market
Contents
About the Author

In observance of Juneteenth, all of our locations will be closed on Friday, June 19.
Start investing with as little as $10, right from your Crews Bank & Trust online or mobile banking platform. Learn more.
Not FDIC Insured; No Bank Guarantee; May Lose Value
FDIC-Insured - Backed by the full faith and credit of the U.S. Government
BankFind
This bank is insured by the Federal Deposit Insurance Corporation. The FDIC Certificate ID is 8021. Click on the Certificate ID # to confirm this bank's FDIC coverage using the FDIC's BankFind tool.
EDIE
EDIE lets consumers and bankers know, on a per-bank basis, how the insurance rules and limits apply to a depositor's accounts-what's insured and what portion (if any) exceeds coverage limits at that bank. Check your deposit insurance coverage >>

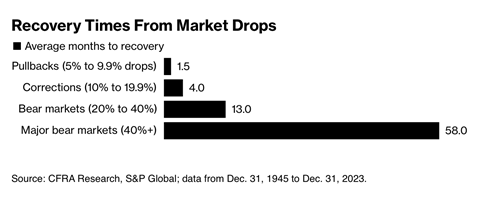
Today’s Chart of the Day from CFRA Research goes all the way back to 1945 and shows the average number of months it takes to “recover” from market declines.The chart shows that most downturns don’t last as long as many may think, and most are around a year or less.It also helps define the terms Wall Street and TV hosts use when discussing these declines. A “Pullback” is a decline more than 5%, a “Correction” is more than 10%, and a” Bear Market” is more than 20%.
Bonus: Why is the term “Bull” for when market goes up and “Bear” for when market goes down? Bulls typically put their heads down and attack up versus bears who often stand up and drop down when attacking. Now you know.
Experienced professionals from our wealth management services team can help you achieve a bright financial future through investment strategies tailored to you. We’ll show you all of the options available and help you choose the ones best suited to you. We’ll provide high-quality, personal service as we work toward your goals together. Our Portfolio Managers do not receive commissions on trades; our recommendations of investments are based solely on your best interests.
Investments are not a deposit or other obligation of, or guaranteed by, the bank, are not FDIC insured, not insured by any federal government agency, and are subject to investment risks, including possible loss of principal.