Chart of the Day: Safe Withdrawal Rates
Contents
About the Author

Online banking will undergo scheduled maintenance beginning at 9 p.m. on Saturday, July 18, and continuing into the early morning hours of Sunday, July 19. During this time, online banking may be intermittently unavailable. We apologize for any inconvenience.
Take the first step toward securing your legacy. Attend a complimentary estate-planning seminar.
Investment products are not insured by the FDIC, are not deposits, and may lose value.
FDIC-Insured - Backed by the full faith and credit of the U.S. Government
BankFind
This bank is insured by the Federal Deposit Insurance Corporation. The FDIC Certificate ID is 8021. Click on the Certificate ID # to confirm this bank's FDIC coverage using the FDIC's BankFind tool.
EDIE
EDIE lets consumers and bankers know, on a per-bank basis, how the insurance rules and limits apply to a depositor's accounts-what's insured and what portion (if any) exceeds coverage limits at that bank. Check your deposit insurance coverage >>

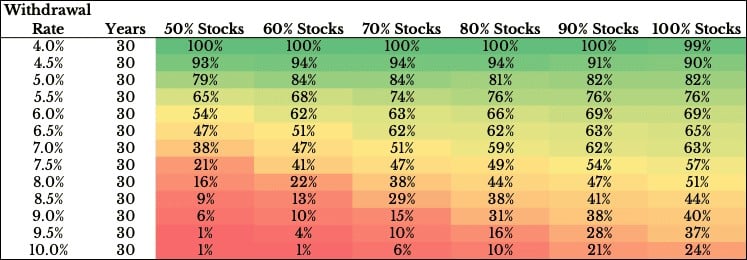
Today’s Chart of the Day was produced by Ofdollarsanddata’s Nick Maggiulli and shows the probability of success between your withdrawal rates, the percentage you withdraw from your portfolio each year, versus the allocation between stocks and bonds. It covers the results of the last 68 full 30-year periods from 1926 to 2022.
Though the past is no predictor of the future, the concept of taking out too much with too little risk versus not taking out enough with too much risk is important. Also, since outcomes can be impacted significantly by minor changes. For example, the chart highlights the risks of losing 1-2% annually from paying too high of fees for underperforming investments.
Experienced professionals from our wealth management services team can help you achieve a bright financial future through investment strategies tailored to you. We’ll show you all of the options available and help you choose the ones best suited to you. We’ll provide high-quality, personal service as we work toward your goals together. Our Portfolio Managers do not receive commissions on trades; our recommendations of investments are based solely on your best interests.
Investments are not a deposit or other obligation of, or guaranteed by, the bank, are not FDIC insured, not insured by any federal government agency, and are subject to investment risks, including possible loss of principal.