Chart of the Day: The Costanza Market
Contents
About the Author

Beware of scams involving fraudulent text messages, spoofed phone numbers and people impersonating bank employees.
Crews Bank & Trust will never contact you to request sensitive personal information, such as your online banking credentials, Social Security number or PIN. If you have questions or something doesn’t feel right, contact us directly at 888-406-2220.
FDIC-Insured - Backed by the full faith and credit of the U.S. Government
BankFind
This bank is insured by the Federal Deposit Insurance Corporation. The FDIC Certificate ID is 8021. Click on the Certificate ID # to confirm this bank's FDIC coverage using the FDIC's BankFind tool.
EDIE
EDIE lets consumers and bankers know, on a per-bank basis, how the insurance rules and limits apply to a depositor's accounts-what's insured and what portion (if any) exceeds coverage limits at that bank. Check your deposit insurance coverage >>



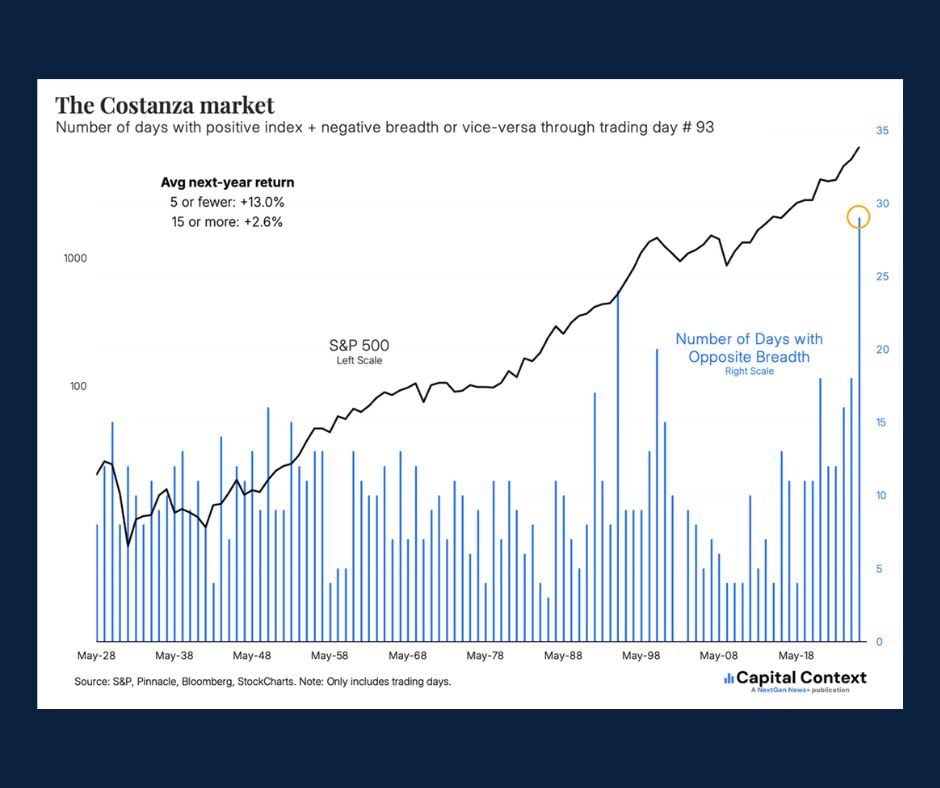
Today's Chart of the Day is from Jason Goepfert on X: "It has been a Costanza market* to a historic degree. Never before has the S&P 500 index gone one way while its stocks went the other on so many days this far into a year."
(*A Costanza market is defined by Investopedia as "buying stocks at market highs when they are most expensive.)
X highlights some interesting stock market behavior. Although the S&P 500 continues to trend high, there has been an unusually large number of days where market breadth has diverged from the index’s direction—meaning the index moved up or down while a majority of its constituent stocks moved the opposite way.
This can be attributed to the recent volatility and significant influence of mega-cap technology companies, which have been key drivers of market performance in recent years.
John joined Crews Bank & Trust as a Trust Investment Associate in September 2025 and was promoted to Portfolio Manager in 2026. He holds a Bachelor of Science in Business Administration with a focus in Finance and Banking from the University of Missouri, along with an Investment Certificate. In his role, he supports portfolio maintenance and analysis while helping clients work toward their financial goals.
Investments are not a deposit or other obligation of, or guaranteed by, the bank, are not FDIC insured, not insured by any federal government agency, and are subject to investment risks, including possible loss of principal. Past performance is not indicative of future results.