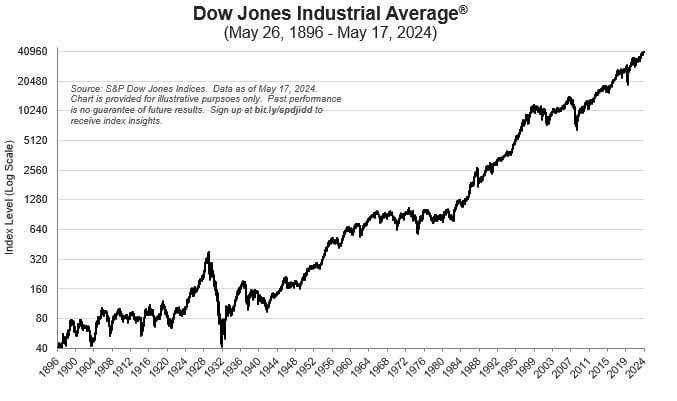
Chart of the Day: The Dow's Double Double
Contents
About the Author

All of our locations will be closed on Saturday, July 4, in celebration of Independence Day.
Take the first step toward securing your legacy. Attend a complimentary estate-planning seminar.
Investment products are not insured by the FDIC, are not deposits, and may lose value.
FDIC-Insured - Backed by the full faith and credit of the U.S. Government
BankFind
This bank is insured by the Federal Deposit Insurance Corporation. The FDIC Certificate ID is 8021. Click on the Certificate ID # to confirm this bank's FDIC coverage using the FDIC's BankFind tool.
EDIE
EDIE lets consumers and bankers know, on a per-bank basis, how the insurance rules and limits apply to a depositor's accounts-what's insured and what portion (if any) exceeds coverage limits at that bank. Check your deposit insurance coverage >>

Today’s Chart of the Day is from the S&P Dow Jones Indices showing the history of the Dow Jones Industrial Average index. It started in 1896 at 40 and recently reached 40,000.The chart highlights the power of the Log Scale, which gives the same space on the chart from 40 to 80, as 20,000 to 40,000 which both reflect the figures have doubled. If the scale was not used, the recent part of the chart would look like it goes straight to the moon. This is especially true if the market goes up 7% over the next 10 years and the index doubles to 80,000 and doubles again to 160,000 20 years from now. That will be a long way from the 40 from so long ago.
Experienced professionals from our wealth management services team can help you achieve a bright financial future through investment strategies tailored to you. We’ll show you all of the options available and help you choose the ones best suited to you. We’ll provide high-quality, personal service as we work toward your goals together. Our Portfolio Managers do not receive commissions on trades; our recommendations of investments are based solely on your best interests.
Investments are not a deposit or other obligation of, or guaranteed by, the bank, are not FDIC insured, not insured by any federal government agency, and are subject to investment risks, including possible loss of principal.