Chart of the Day - Trust in Media is 'None at All'
Contents
About the Author

Small business? Turn your phone into an on-the-go card reader with Tap2Local.
Take the first step toward securing your legacy. Attend a complimentary estate-planning seminar.
Investment products are not insured by the FDIC, are not deposits, and may lose value.
FDIC-Insured - Backed by the full faith and credit of the U.S. Government
BankFind
This bank is insured by the Federal Deposit Insurance Corporation. The FDIC Certificate ID is 8021. Click on the Certificate ID # to confirm this bank's FDIC coverage using the FDIC's BankFind tool.
EDIE
EDIE lets consumers and bankers know, on a per-bank basis, how the insurance rules and limits apply to a depositor's accounts-what's insured and what portion (if any) exceeds coverage limits at that bank. Check your deposit insurance coverage >>

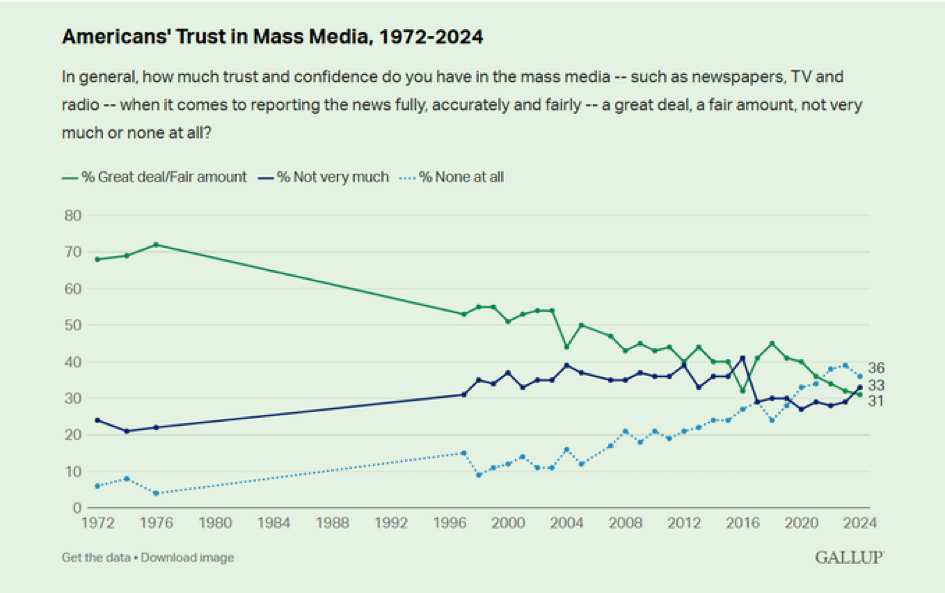
Today’s Chart of the Day is from Gallup and shows the change in American’s Trust in Mass Media from 1972 to 2024. The choice of “None at all” went from a low of 5% in 1972 to the high of 36% in 2024, beating out “Great deal/Fair amount,” which fell from a peak of 68% to its lowest of 31%.
The article suggests this coincides with the 1980 start of the 24-hour news cycle, further fueled by additional news channels in the 1990s, then the invention of social media in early 2000’s, culminating with the rise of smart phones in the early 2010’s.
Where do we go from here? We are probably stuck in a three-way split between the categories until a new technology is invented.
Experienced professionals from our wealth management services team can help you achieve a bright financial future through investment strategies tailored to you. We’ll show you all of the options available and help you choose the ones best suited to you. We’ll provide high-quality, personal service as we work toward your goals together. Our Portfolio Managers do not receive commissions on trades; our recommendations of investments are based solely on your best interests.
Investments are not a deposit or other obligation of, or guaranteed by, the bank, are not FDIC insured, not insured by any federal government agency, and are subject to investment risks, including possible loss of principal.