
Chart of the Day: What's in Your Portfolio?
Contents
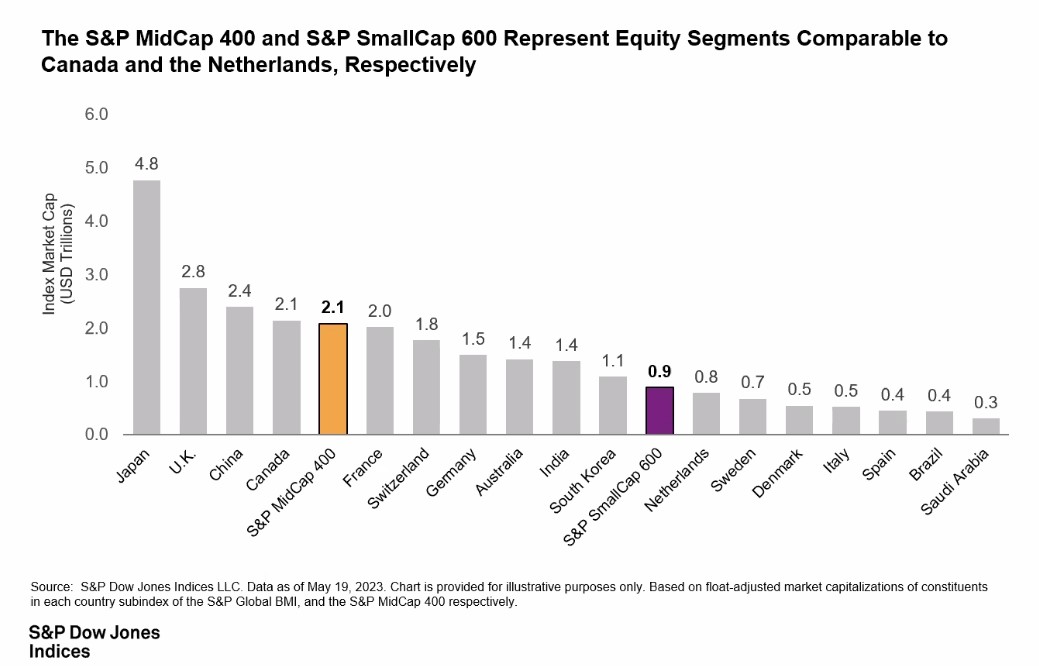
Today’s Chart of the Day from S&P Global shows the size of the United States S&P 400 Mid-Cap and S&P 600 Small-Cap Indexes vs. the size of other country’s entire market value.
As a reminder, the S&P 400 Mid-Cap is the next 400 companies in size after the S&P 500, and S&P 600 Small-Cap is the next 600 companies after that. So, if you owned all three, you would own 1,500 companies:
S&P 500 Large-Cap
S&P 400 Mid-Cap
+S&P 600 Small-Cap
Total = 1,500
To see how important they are, the United States Mid-Cap is roughly the size of Canada and France. The United States Small-Cap is larger than the Netherlands and Sweden.
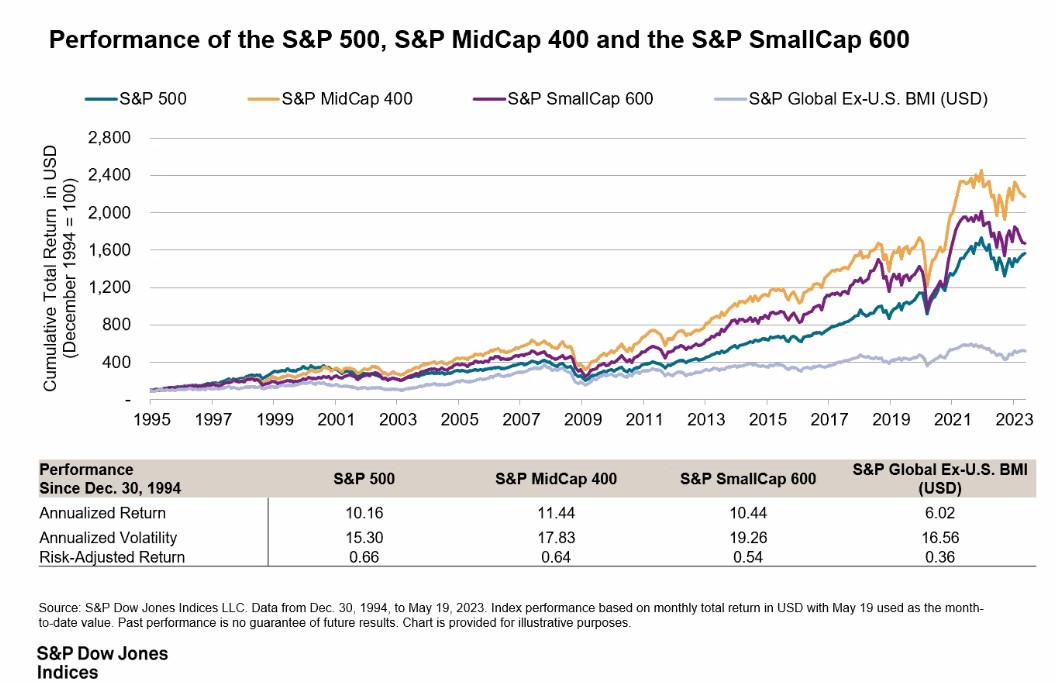
Today’s bonus chart shows that if you had owned them since they were formed in 1994, both the Mid- and Small-Cap indexes have outperformed the Large-Cap index, which along with reducing risk due to increased diversification, is why we own them in all of our portfolios.
About the Author
