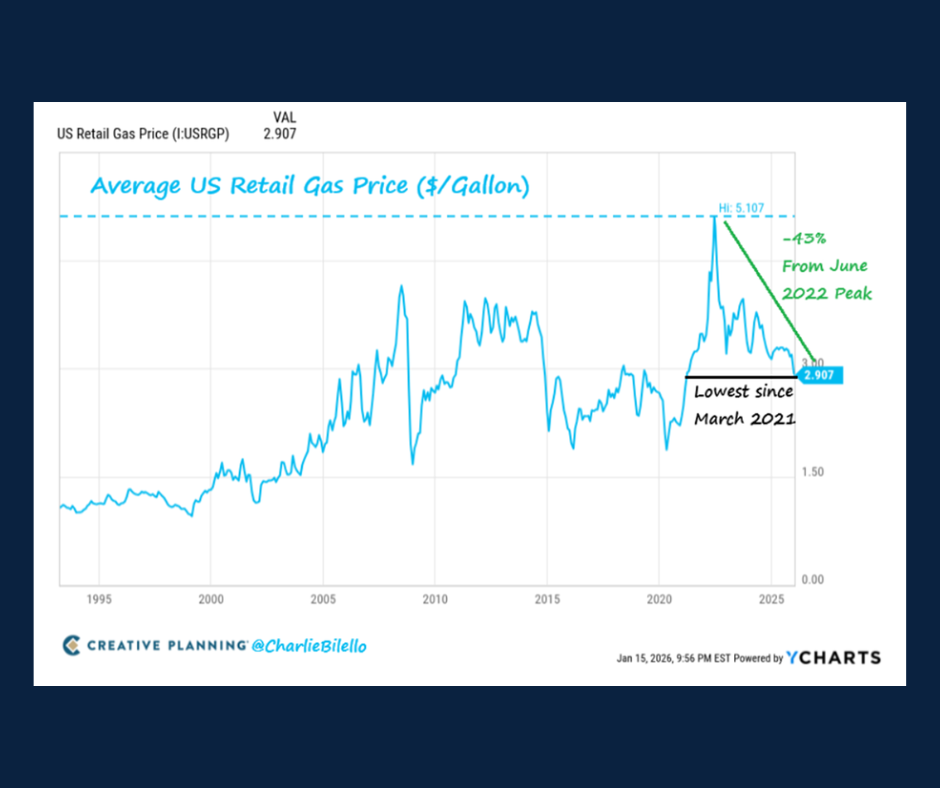
Chart of the Day: Average US Retail Gas Price
Contents
About the Author

All of our locations will be closed on Saturday, July 4, in celebration of Independence Day.
Take the first step toward securing your legacy. Attend a complimentary estate-planning seminar.
Investment products are not insured by the FDIC, are not deposits, and may lose value.
FDIC-Insured - Backed by the full faith and credit of the U.S. Government
BankFind
This bank is insured by the Federal Deposit Insurance Corporation. The FDIC Certificate ID is 8021. Click on the Certificate ID # to confirm this bank's FDIC coverage using the FDIC's BankFind tool.
EDIE
EDIE lets consumers and bankers know, on a per-bank basis, how the insurance rules and limits apply to a depositor's accounts-what's insured and what portion (if any) exceeds coverage limits at that bank. Check your deposit insurance coverage >>

Today’s Chart of the Day from @CharlieBilello shows the trend of US retail gas prices. Down 43% from the 2022 peak, prices are falling close to a 5-year low.
This decline is meaningful for consumers because lower gas prices directly reduce day‑to‑day living expenses, especially for households that rely on driving for commuting, errands, or work.
When fuel costs fall, consumers have more disposable income to spend on other goods and services, which can help support broader economic activity. Additionally, lower gas prices tend to ease overall inflation pressures, improving purchasing power and reducing strain on family budgets.
Gregory is an experienced financial manager specializing in investment holdings for individuals, trusts, IRAs, private foundations, and nonprofit organizations across Florida. A Mercy College graduate with a degree in government, he began his career in technology before transitioning to financial management in 2009.
Investments are not a deposit or other obligation of, or guaranteed by, the bank, are not FDIC insured, not insured by any federal government agency, and are subject to investment risks, including possible loss of principal.