Chart of the Day: Cash is Rarely King
Contents
About the Author

Our new Fort Myers branch is open! Visit us at The Parks Shops at Andrea Lane, 14261 S Tamiami Trail Unit 5.
FDIC-Insured - Backed by the full faith and credit of the U.S. Government
BankFind
This bank is insured by the Federal Deposit Insurance Corporation. The FDIC Certificate ID is 8021. Click on the Certificate ID # to confirm this bank's FDIC coverage using the FDIC's BankFind tool.
EDIE
EDIE lets consumers and bankers know, on a per-bank basis, how the insurance rules and limits apply to a depositor's accounts-what's insured and what portion (if any) exceeds coverage limits at that bank. Check your deposit insurance coverage >>



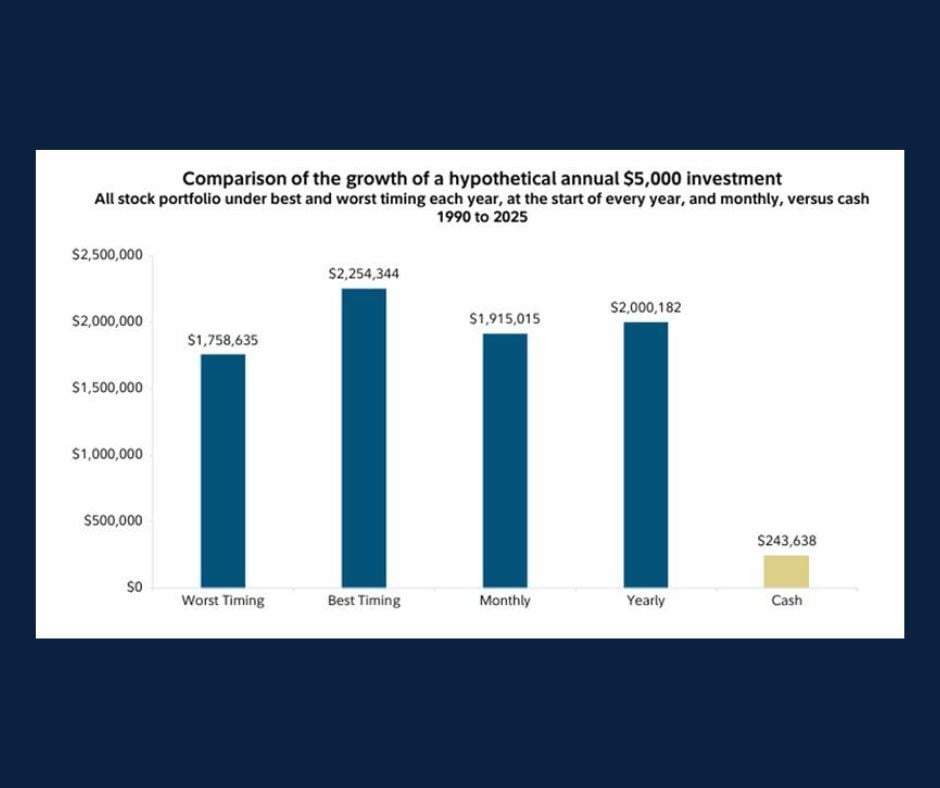
Today’s Chart of the Day from Fidelity’s "2026 Cash is Rarely King" presentation explores the outcomes of investing $5,000 at different points throughout the year versus holding the same amount in a cash-only portfolio from 1990-2025.
To no surprise, investing at the best possible time each year (the market bottom) produced the greatest returns. Investing $5,000 in one lump sum at the beginning of the year outperformed the monthly investment strategy, approximately $417 per month, by roughly 4.5% at the end of the period.
The most compelling takeaway is that investing at the worst possible time each year (the market peak) well outperformed the cash-only portfolio, rewarding investors with substantial gains regardless of any risk associated with timing. The chart serves as a powerful reminder of a fundamental investing principle: time in the market is more important than timing the market.
John joined Crews Bank & Trust as a Trust Investment Associate in September 2025. He holds a Bachelor of Science in Business Administration with a focus in Finance and Banking from the University of Missouri, along with an Investment Certificate. In his role, he supports portfolio maintenance and analysis while helping clients work toward their financial goals.
Investments are not a deposit or other obligation of, or guaranteed by, the bank, are not FDIC insured, not insured by any federal government agency, and are subject to investment risks, including possible loss of principal. Past performance is not indicative of future results.