
No matter which card you choose, your business will benefit from important
features like:
- Free online expense reporting tools.
- No fee for additional employee cards.
- Mobile payment capability for added convenience.
- Zero Fraud Liability.* You won’t be liable for fraudulent purchases when your card is lost or stolen.
- Cardmember Service available 24 hours a day/365 days per year.

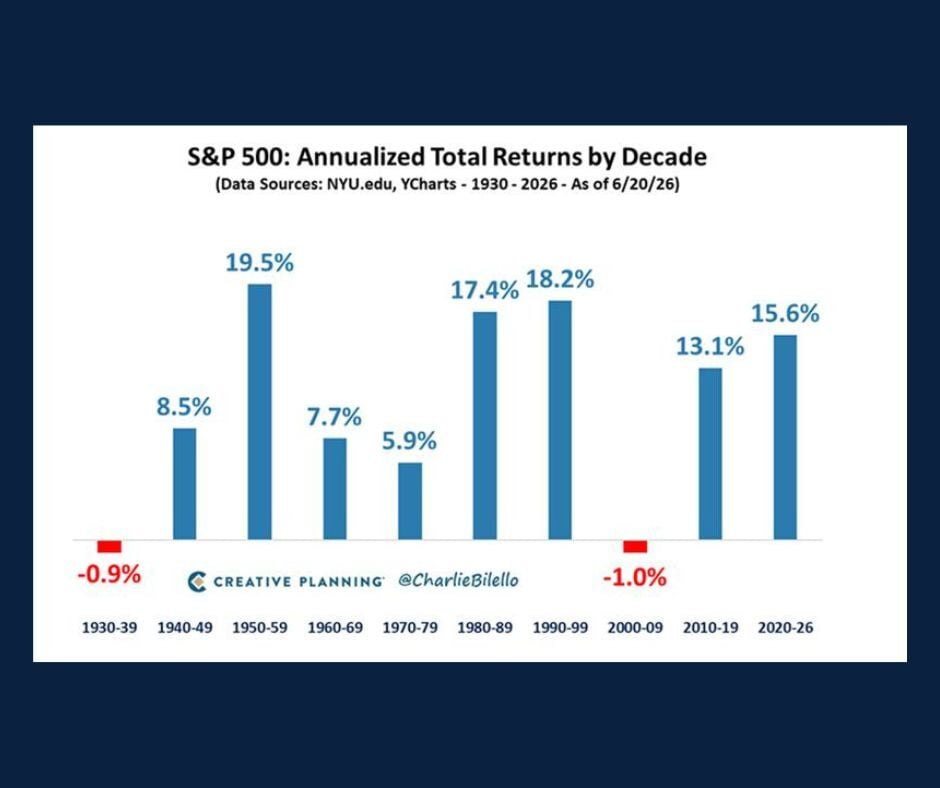
Chart of the Day: S&P By Decade
July 30, 2026
Today's Chart of the Day from Charlie Bilello’s blog, "The Week in Charts," from June 24, 2026, examines the S&P 500's performance by decade, with...
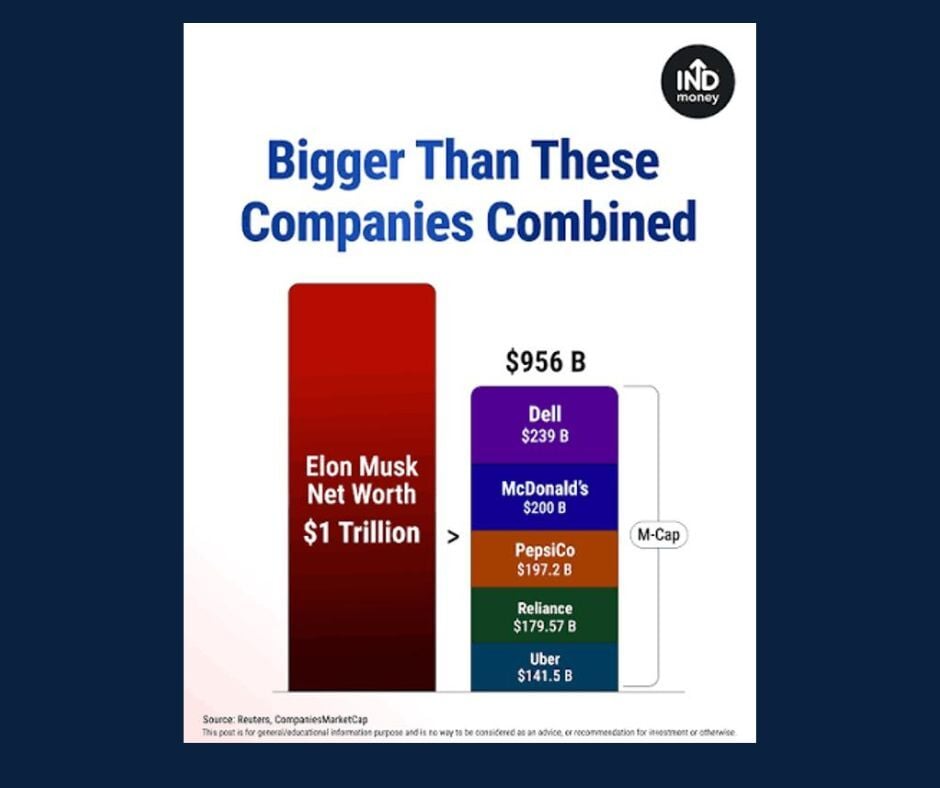
Chart of the Day: Elon Musk is Bigger
July 28, 2026
Today’s Chart of the Day comes from indmoneyapp on Instagram and compares Elon Musk’s ~ $1 trillion net worth to the market values of five well known...
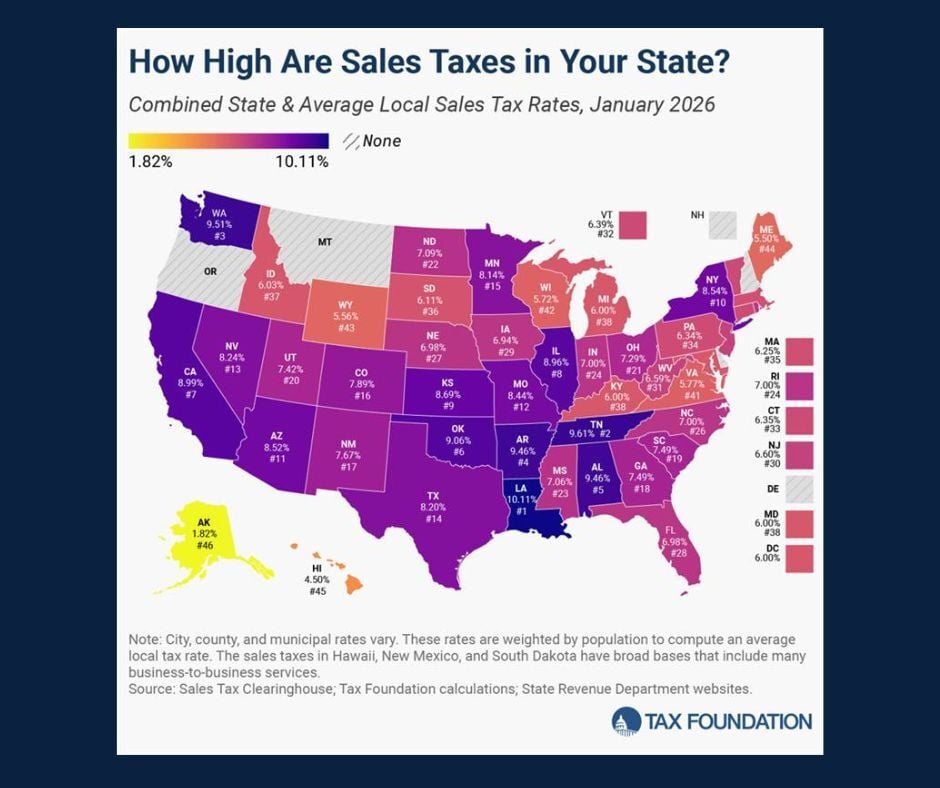
Chart of the Day: How High Sales Tax by State?
July 23, 2026
Today’s Chart of the Day from the Tax Foundation’s "2026 Sales Tax Rates | Sales Taxes by State" highlights combined state and local sales tax rates...