Chart of the Day: Driver vs. Driverless Cars
Contents
About the Author

Small business? Turn your phone into an on-the-go card reader with Tap2Local.
Take the first step toward securing your legacy. Attend a complimentary estate-planning seminar.
Investment products are not insured by the FDIC, are not deposits, and may lose value.
FDIC-Insured - Backed by the full faith and credit of the U.S. Government
BankFind
This bank is insured by the Federal Deposit Insurance Corporation. The FDIC Certificate ID is 8021. Click on the Certificate ID # to confirm this bank's FDIC coverage using the FDIC's BankFind tool.
EDIE
EDIE lets consumers and bankers know, on a per-bank basis, how the insurance rules and limits apply to a depositor's accounts-what's insured and what portion (if any) exceeds coverage limits at that bank. Check your deposit insurance coverage >>

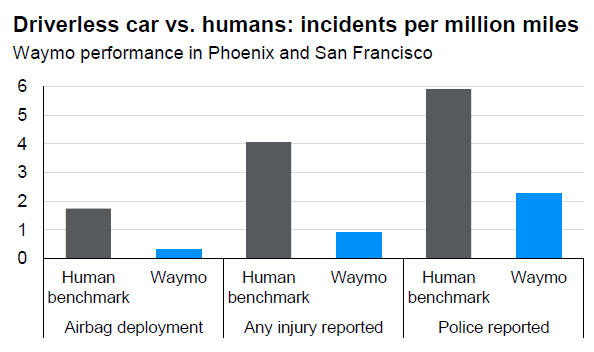
Today’s Chart of the Day is from a Waymo*/Stanford report shared by JP Morgan that shows the “incidents per million miles" comparing human drivers, in the gray bars, to driverless Waymo autos represented in the blue bars.
As you can see from the chart, driverless cars have shown to have significantly lower airbag deployments, injuries, and police reported incidents.
If the adoption of driverless car technology continues, this could have far-reaching implications, such as lowering auto insurance costs, the need for replacement parts and repair technicians, along with a change to the type of autos that may favor comfort over performance.
*Waymo is what was formerly known as the Google self-driving car project.
Experienced professionals from our wealth management services team can help you achieve a bright financial future through investment strategies tailored to you. We’ll show you all of the options available and help you choose the ones best suited to you. We’ll provide high-quality, personal service as we work toward your goals together. Our Portfolio Managers do not receive commissions on trades; our recommendations of investments are based solely on your best interests.
Investments are not a deposit or other obligation of, or guaranteed by, the bank, are not FDIC insured, not insured by any federal government agency, and are subject to investment risks, including possible loss of principal.