Chart of the Day: Five Years in Real Estate
Contents
About the Author

FDIC-Insured - Backed by the full faith and credit of the U.S. Government
BankFind
This bank is insured by the Federal Deposit Insurance Corporation. The FDIC Certificate ID is 8021. Click on the Certificate ID # to confirm this bank's FDIC coverage using the FDIC's BankFind tool.
EDIE
EDIE lets consumers and bankers know, on a per-bank basis, how the insurance rules and limits apply to a depositor's accounts-what's insured and what portion (if any) exceeds coverage limits at that bank. Check your deposit insurance coverage >>

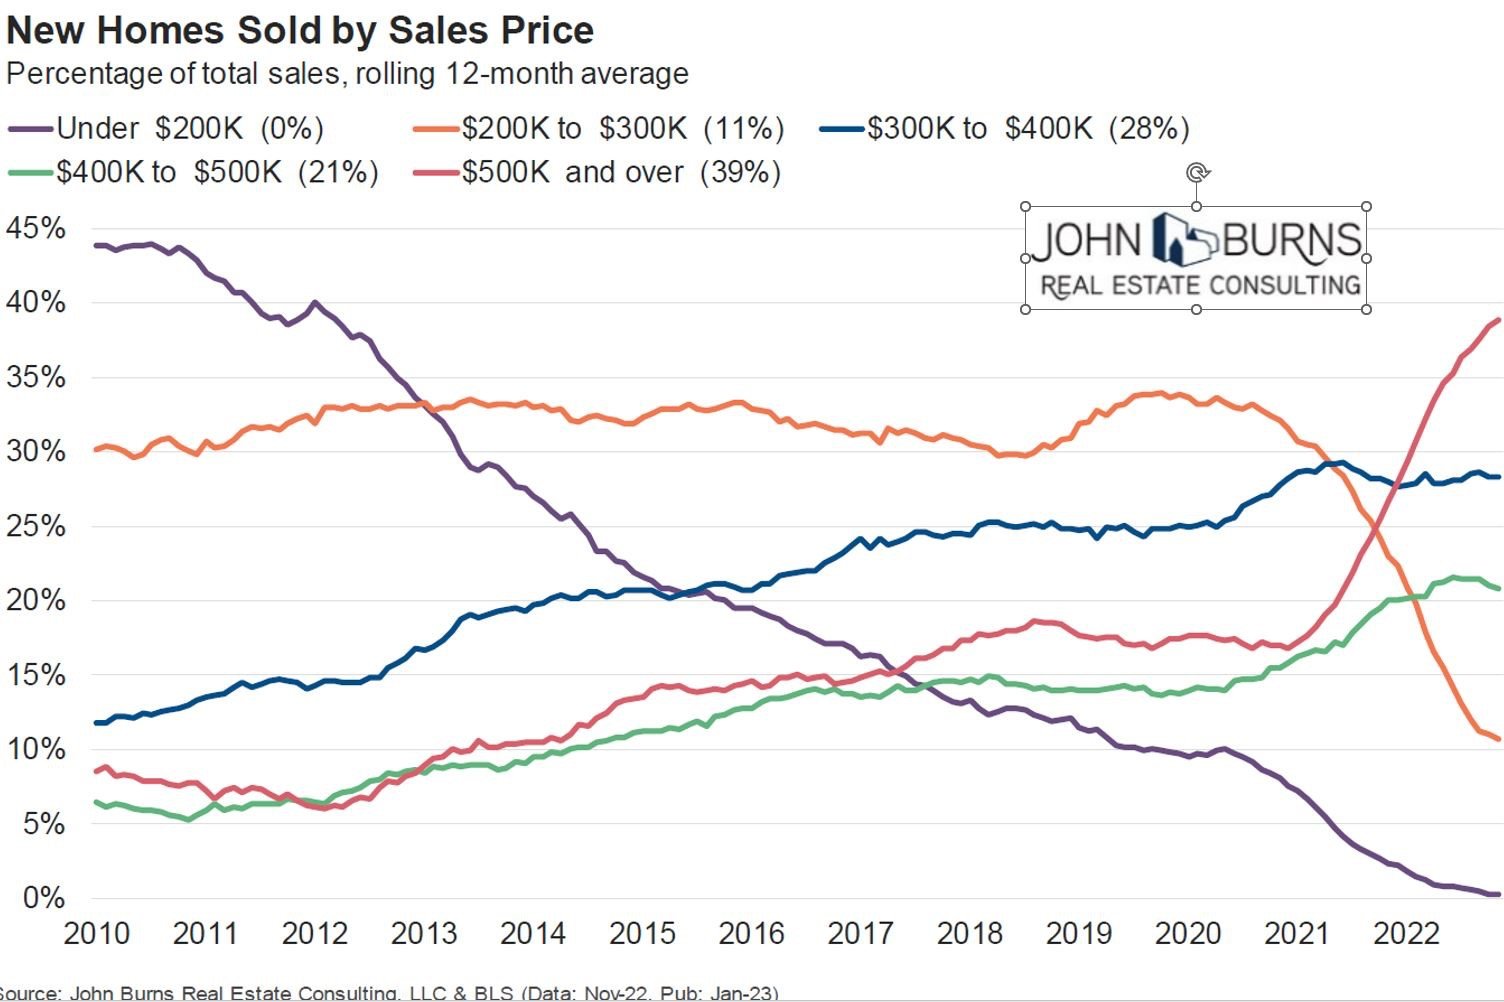
Today’s Chart of the Day comes from John Burns and shows the historical percentages of homes sold by sales price going back to 2010.
As you would expect, over time the cost of new homes is going up. This is evident by the long, slow decline of homes that cost $200K or less: 45% of homes sold in 2010 to 0% in 2022. However, I was surprised by the sharp drop in homes sold in the $200K to $300K range: 35% before the 2020 pandemic to only 11% in 2022.
In five short years, we went from just under half of new homes costing $300K or less to only one out of ten.
Experienced professionals from our wealth management services team can help you achieve a bright financial future through investment strategies tailored to you. We’ll show you all of the options available and help you choose the ones best suited to you. We’ll provide high-quality, personal service as we work toward your goals together. Our Portfolio Managers do not receive commissions on trades; our recommendations of investments are based solely on your best interests.
Investments are not a deposit or other obligation of, or guaranteed by, the bank, are not FDIC insured, not insured by any federal government agency, and are subject to investment risks, including possible loss of principal.