Chart of the Day: The Stock Market and Tech Innovations
Contents
About the Author

Beware of scams involving fraudulent text messages, spoofed phone numbers and people impersonating bank employees.
Crews Bank & Trust will never contact you to request sensitive personal information, such as your online banking credentials, Social Security number or PIN. If you have questions or something doesn’t feel right, contact us directly at 888-406-2220.
FDIC-Insured - Backed by the full faith and credit of the U.S. Government
BankFind
This bank is insured by the Federal Deposit Insurance Corporation. The FDIC Certificate ID is 8021. Click on the Certificate ID # to confirm this bank's FDIC coverage using the FDIC's BankFind tool.
EDIE
EDIE lets consumers and bankers know, on a per-bank basis, how the insurance rules and limits apply to a depositor's accounts-what's insured and what portion (if any) exceeds coverage limits at that bank. Check your deposit insurance coverage >>



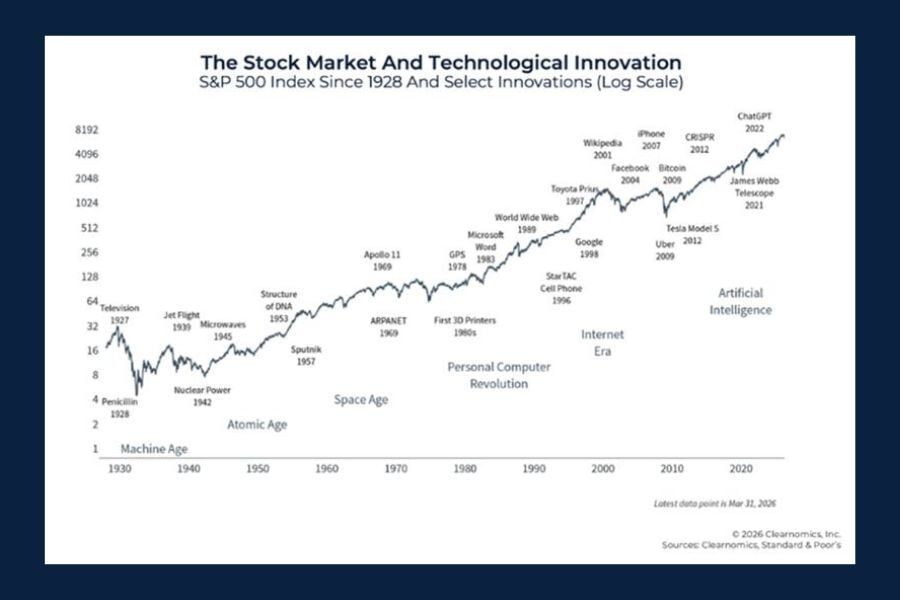
Today's Chart of the Day from Kitces.com, "10 Charts To Address Concerns On 2026 Geopolitical Conflict," presents an interesting timeline of market growth and innovation eras.
For the past several years, AI has been the main driver of market excitement, but the conversation is starting to shift from simply building it to figuring out who is actually making money from it.
Notable breakthroughs in technology tend to start with heavy infrastructure spending, move into broader adoption, and eventually deliver real productivity gains that lift the broader economy.
We’ve seen this pattern before with railroads, electricity, and the internet. Today, massive investment surrounding AI echoes that early infrastructure phase, while investors are increasingly focused on earnings, valuations, and real-world use cases. The chart reinforces that innovation has consistently fueled long‑term market growth, even though leadership within the market evolves as each technology matures.
John joined Crews Bank & Trust as a Trust Investment Associate in September 2025 and was promoted to Portfolio Manager in 2026. He holds a Bachelor of Science in Business Administration with a focus in Finance and Banking from the University of Missouri, along with an Investment Certificate. In his role, he supports portfolio maintenance and analysis while helping clients work toward their financial goals.
Investments are not a deposit or other obligation of, or guaranteed by, the bank, are not FDIC insured, not insured by any federal government agency, and are subject to investment risks, including possible loss of principal. Past performance is not indicative of future results.