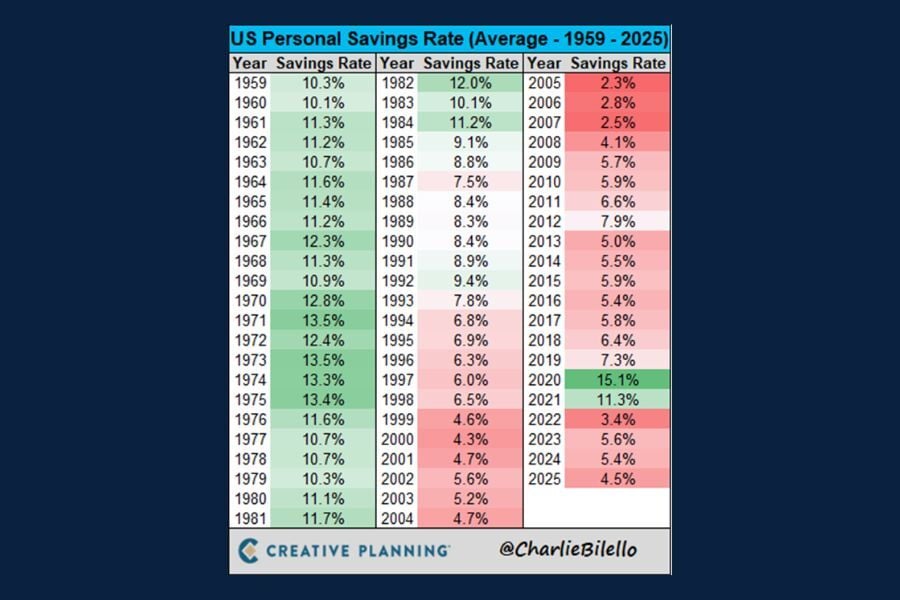
Chart of the Day: U.S. Personal Savings Rates
Contents
About the Author

Small business? Turn your phone into an on-the-go card reader with Tap2Local.
Take the first step toward securing your legacy. Attend a complimentary estate-planning seminar.
Investment products are not insured by the FDIC, are not deposits, and may lose value.
FDIC-Insured - Backed by the full faith and credit of the U.S. Government
BankFind
This bank is insured by the Federal Deposit Insurance Corporation. The FDIC Certificate ID is 8021. Click on the Certificate ID # to confirm this bank's FDIC coverage using the FDIC's BankFind tool.
EDIE
EDIE lets consumers and bankers know, on a per-bank basis, how the insurance rules and limits apply to a depositor's accounts-what's insured and what portion (if any) exceeds coverage limits at that bank. Check your deposit insurance coverage >>

Today’s Chart of the Day from CharlieBilello gives us data for over 60 years of U.S. personal savings rates.
The chart shows a clear long-term decline in the rate of personal savings in the U.S., with only temporary spikes during periods of economic stress.
This downward trend reflects a shift toward a consumption‑driven economy, easier access to consumer credit, and rising living costs that have outpaced wage growth for many households, leaving less room to save.
Looking ahead, savings rates are likely to remain lower than historical norms, increasing household vulnerability to economic shocks. As a result, long‑term financial security will depend on automated saving, employer-sponsored plans, and proactive financial planning rather than elevated personal savings rates alone.
John joined Crews Bank & Trust as a Trust Investment Associate in September 2025. He holds a Bachelor of Science in Business Administration with a focus in Finance and Banking from the University of Missouri, along with an Investment Certificate. In his role, he supports portfolio maintenance and analysis while helping clients work toward their financial goals.
Investments are not a deposit or other obligation of, or guaranteed by, the bank, are not FDIC insured, not insured by any federal government agency, and are subject to investment risks, including possible loss of principal.