
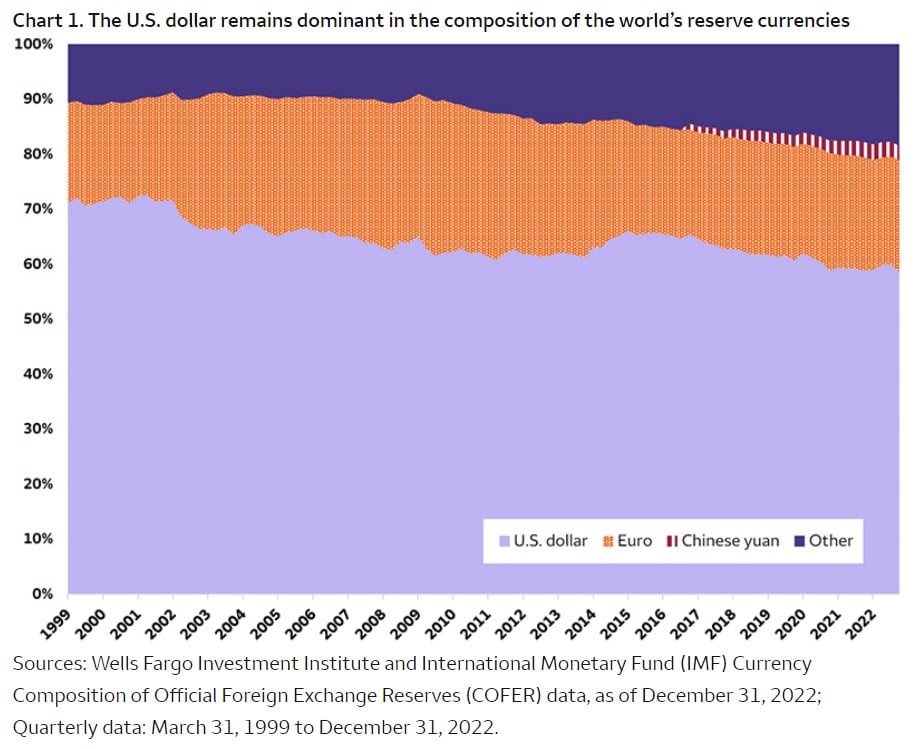
Chart of the Day: US Dollar is Dominant
Today’s Chart of the Day was shared by Crews Bank & Trust Portfolio Manager Angie Parsons and comes from Wells Fargo Advisors. It shows that for all..
Chart of the Day: View from the Top of the Hill Online Presentation
Join Samuel A. Kiburz, Chief Investment Officer, Senior Vice President, for a virtual macroeconomics presentation.
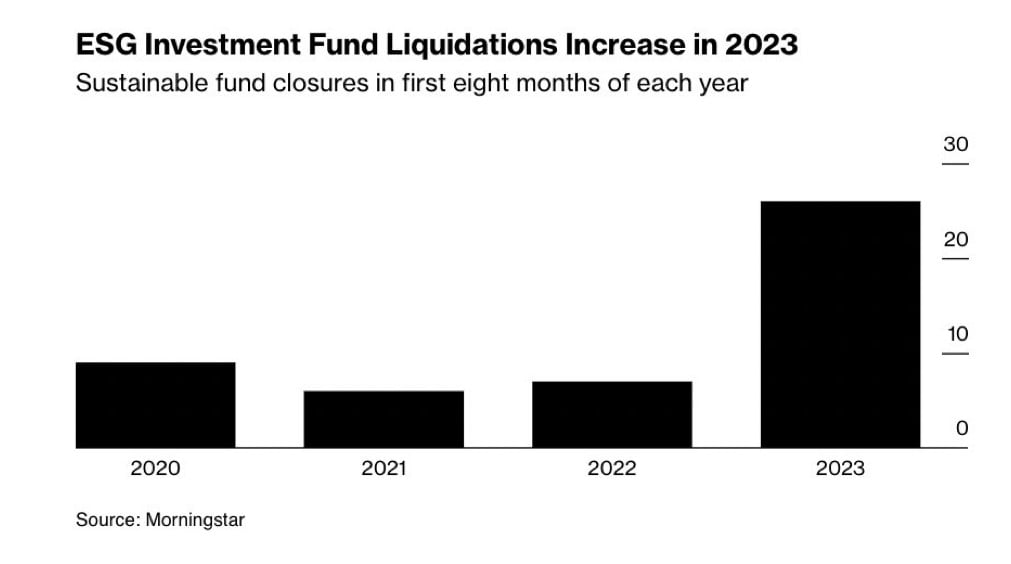
Chart of the Day: To ESG or Not to ESG
Today’s Chart of the Day from Morningstar shows an increase in the closing of ESG Funds (Environmental, Social, and Governance funds).
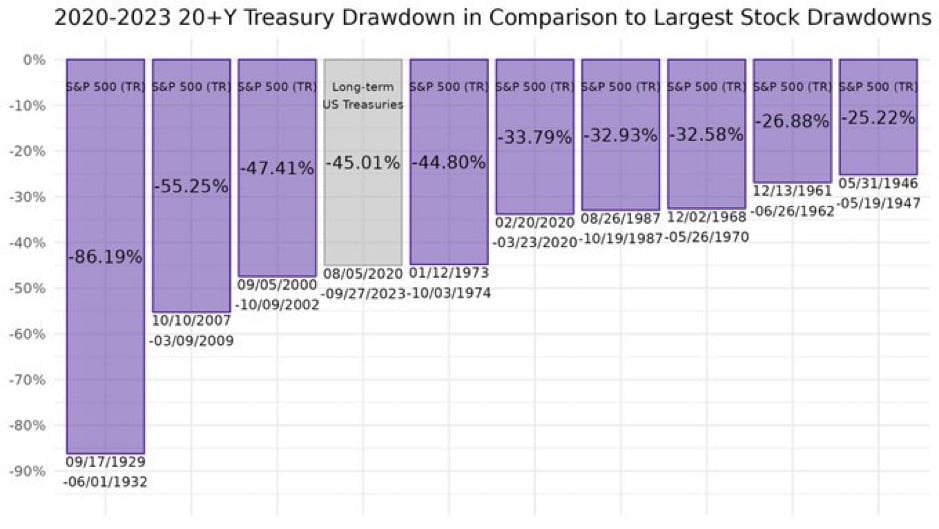
Chart of the Day: 4th Largest in History
Today’s Chart of the Day from Michael Gayed, @leadlagreport on X, shows the decline in the price of stocks and bonds going back to the Great..
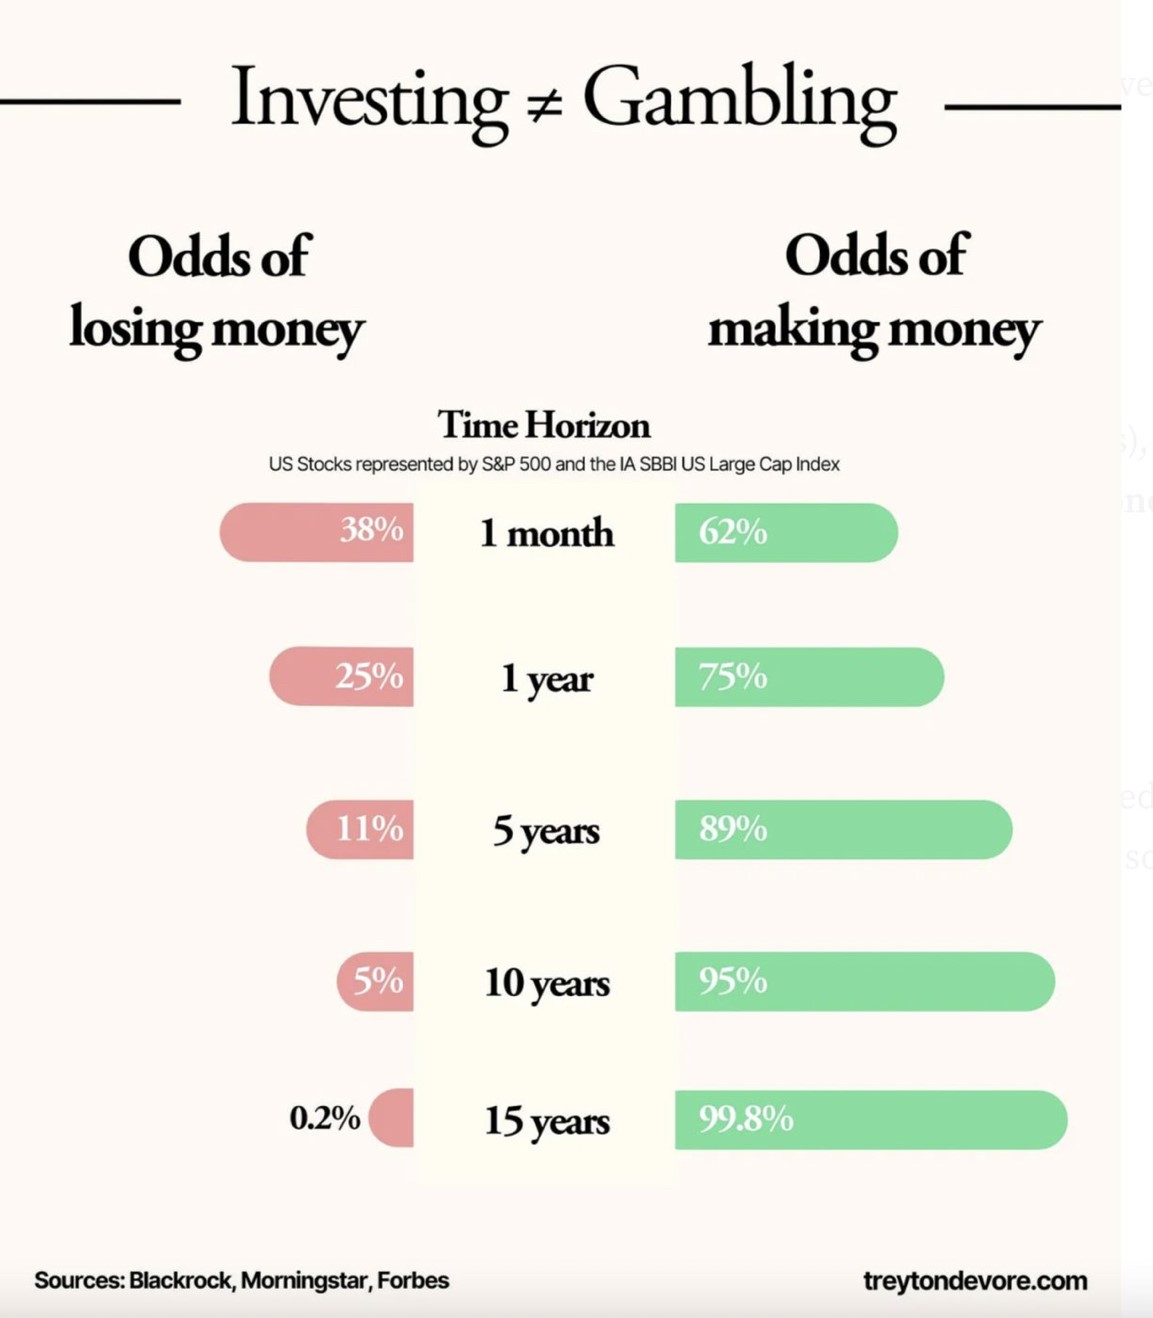
Chart of the Day: Investing vs. Gambling
Today’s Chart of the Day from Treyton Devore shows the odds of losing vs. making money.
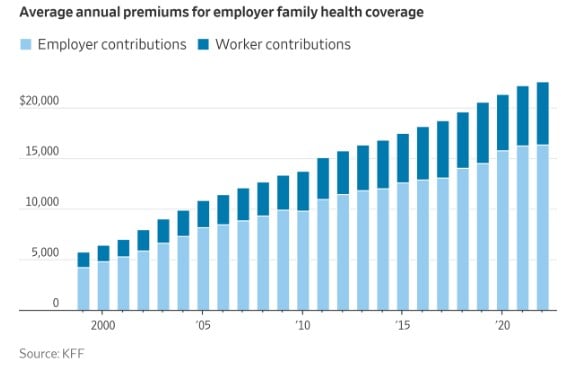
Chart of the Day: 6% Annual Health Cost Increases
Today’s Chart of the Day comes from Charlie Bilello, @charliebilello on X, and shows the average annual premiums for employer family health coverage...

Chart of the Day: Richest Billionaires
Today's Chart of the Day from Visual Capitalist shows the richest billionaire in every state.
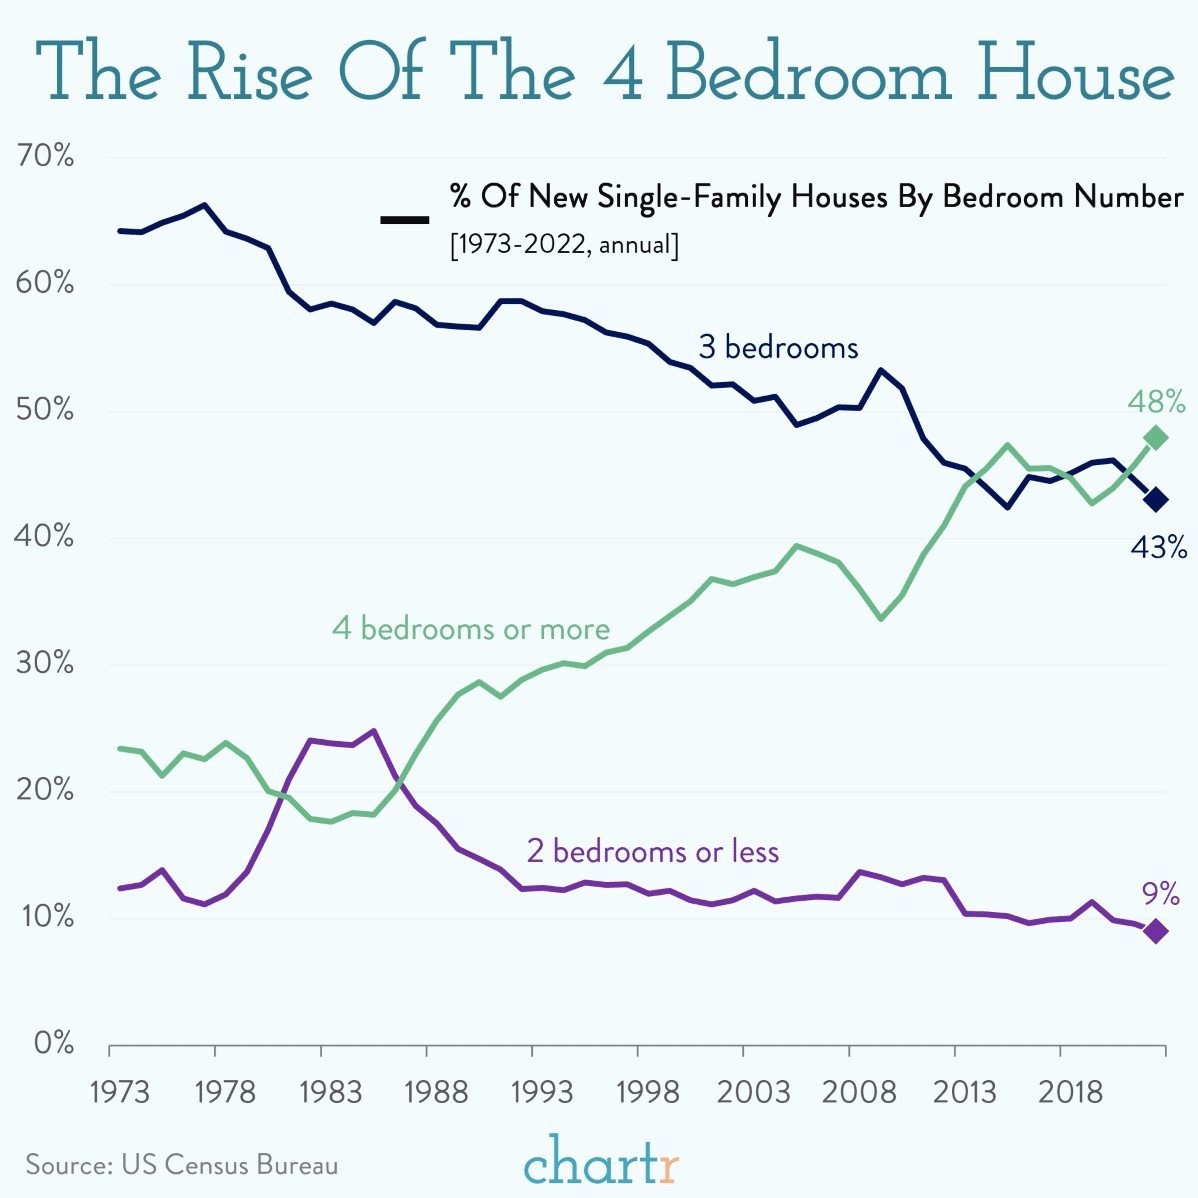
Chart of the Day: 3 to 4 Bedrooms
Today’s Chart of the Day from Chartr shows that 4+ bedroom houses went from being 25% of homes in 1973 to just under 50% of the nearly one million..
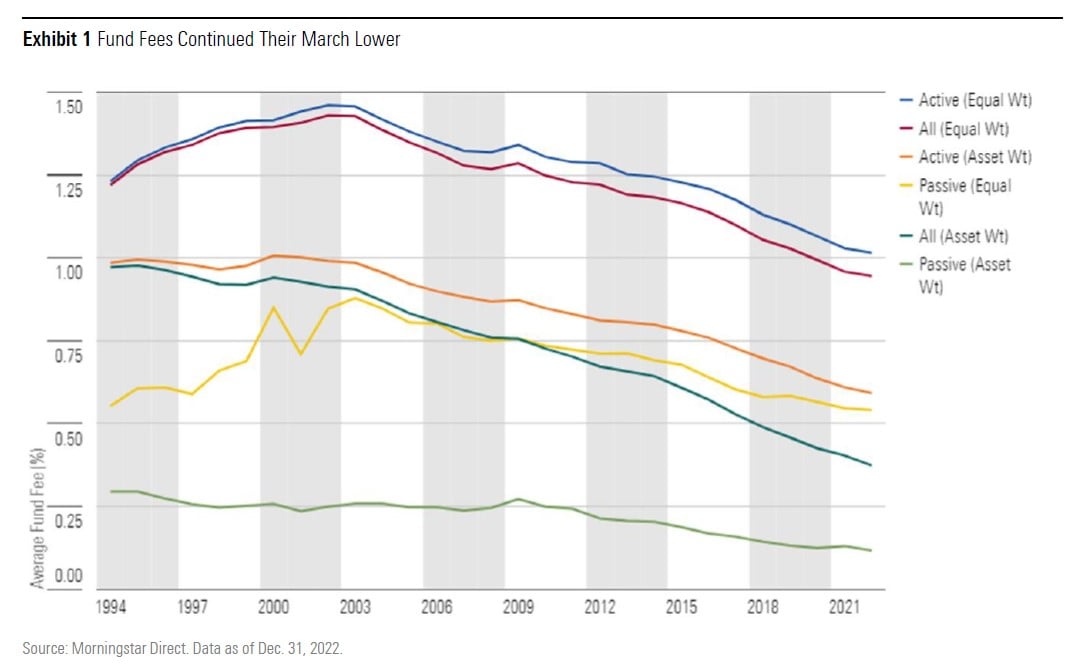
Chart of the Day: Fund Fees Are Declining
Today’s Chart of the Day comes from the annual 2022 US Fund Fee Study, which was released last month. Conducted by Morningstar, this study goes back..