Chart of the Day: The Probability of Negative Returns
Contents
About the Author

All of our locations will be closed on Monday, October 12, in observance of Columbus Day. Remember, you can bank anytime, anywhere with online and mobile banking.
FDIC-Insured - Backed by the full faith and credit of the U.S. Government
BankFind
This bank is insured by the Federal Deposit Insurance Corporation. The FDIC Certificate ID is 8021. Click on the Certificate ID # to confirm this bank's FDIC coverage using the FDIC's BankFind tool.
EDIE
EDIE lets consumers and bankers know, on a per-bank basis, how the insurance rules and limits apply to a depositor's accounts-what's insured and what portion (if any) exceeds coverage limits at that bank. Check your deposit insurance coverage >>



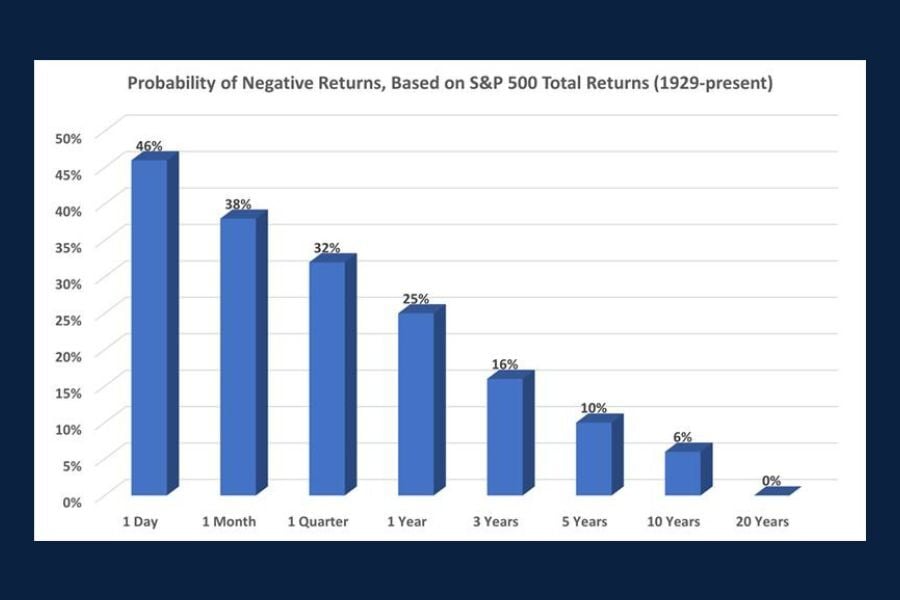
Today's Chart of the Day, "The Most Important Investment Chart You'll Ever See," is from The Motley Fool and serves as a good reminder for investors to think long-term.
The chart shows the probability of negative S&P 500 returns over various timeframes dating back to 1929.
The statistical chance of negative returns over short horizons like one day or even one quarter are what you might expect, although the chances for positive returns are greater.
Over longer periods, however, the advantage of staying invested becomes overwhelming. Historically, the probability of a negative return over a 10-year period has been just 6%, implying a 94% likelihood of a positive outcome.
Most strikingly, the chart shows that there has never been a 20-year period in which investors experienced negative returns. This reinforces the idea that the path to wealth may not be fast or smooth, but it is highly achievable for those who remain patient and disciplined.
John joined Crews Bank & Trust as a Trust Investment Associate in September 2025 and was promoted to Portfolio Manager in 2026. He holds a Bachelor of Science in Business Administration with a focus in Finance and Banking from the University of Missouri, along with an Investment Certificate. In his role, he supports portfolio maintenance and analysis while helping clients work toward their financial goals.
Investments are not a deposit or other obligation of, or guaranteed by, the bank, are not FDIC insured, not insured by any federal government agency, and are subject to investment risks, including possible loss of principal. Past performance is not indicative of future results.