



Skip to content

Beware of scams involving fraudulent text messages, spoofed phone numbers and people impersonating bank employees.
Crews Bank & Trust will never contact you to request sensitive personal information, such as your online banking credentials, Social Security number or PIN. If you have questions or something doesn’t feel right, contact us directly at 888-406-2220.

Get Started 863-222-7005

Blog

Your Weekly
Financial Forecast


Stay informed with sound financial know-how

Chart of the Day: S&P 500 Net Profit

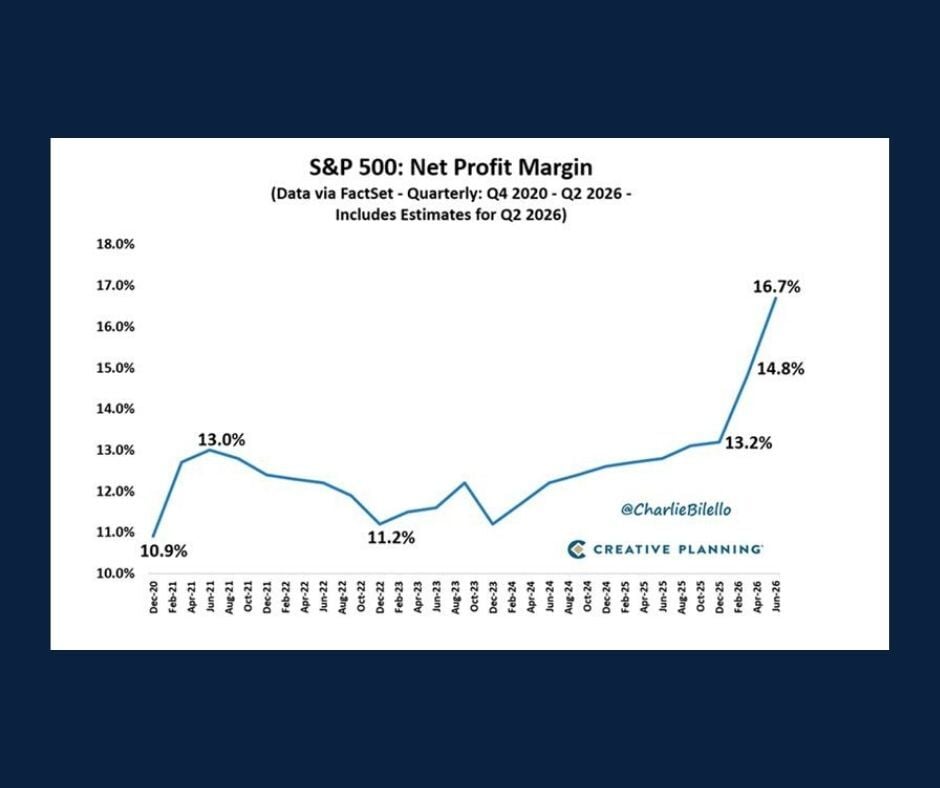
Today’s Chart of the Day from Charlie Bilello's Blog, The State of the Markets (August 2026), highlights a sharp rise in S&P 500 profit margins after..

Read More

Chart of the Day: Invested Wealth

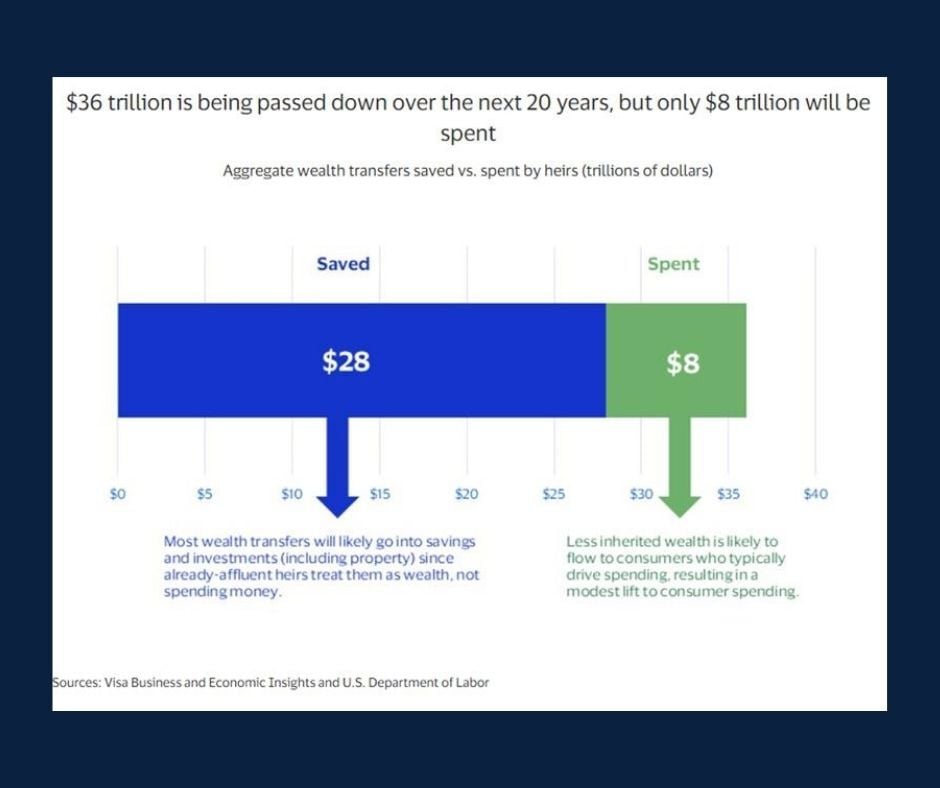
Today’s Chart of the Day from Visa's The great wealth transfer reality check estimates that a significant percentage of wealth transferred over the..

Read More

Chart of the Day: Nvidia Keeps Winning

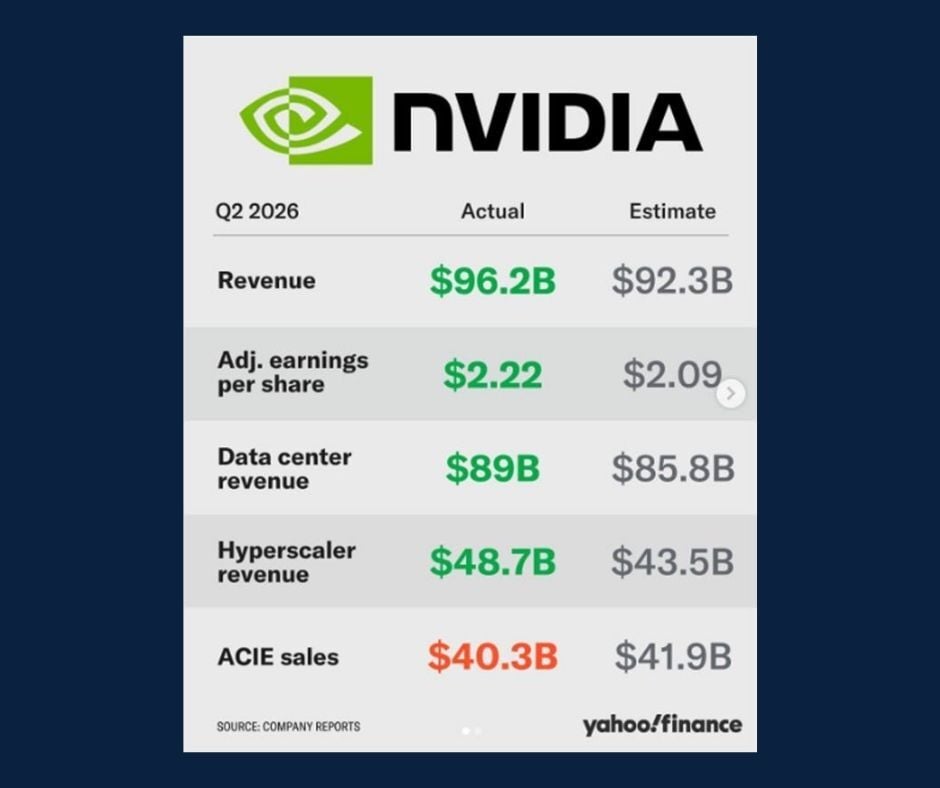
Today’s Chart of the Day from Yahoo Finance on Instagram breaks down Nvidia’s most recent earnings report for Q2 2026.

Read More

Chart of the Day: Growth of $1

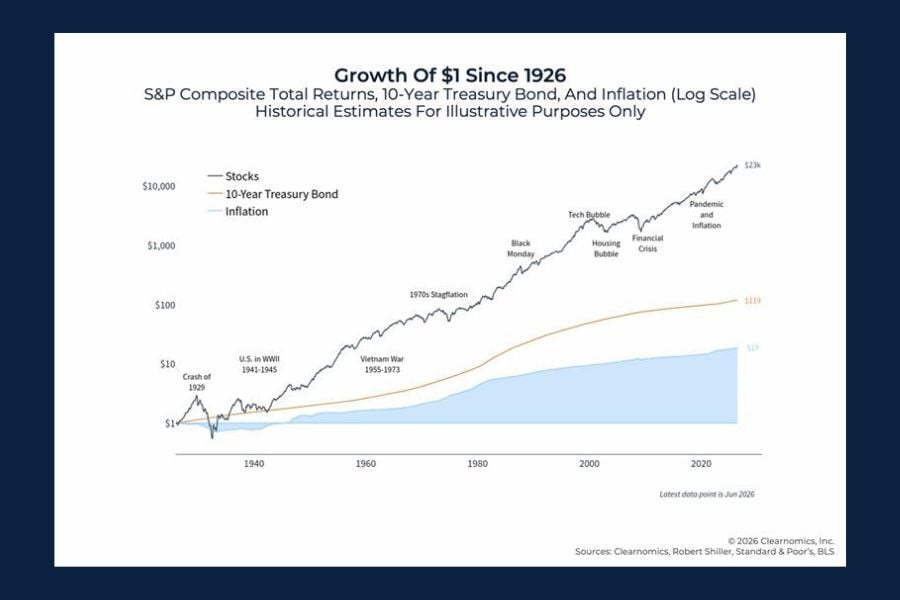
Today's Chart of the Day from Clearnomics' 10 Charts on the 2026 Mid-Year Market Outlook reveals the power of compounding over the past century.

Read More

Chart of the Day: Is a Million Dollars Enough?

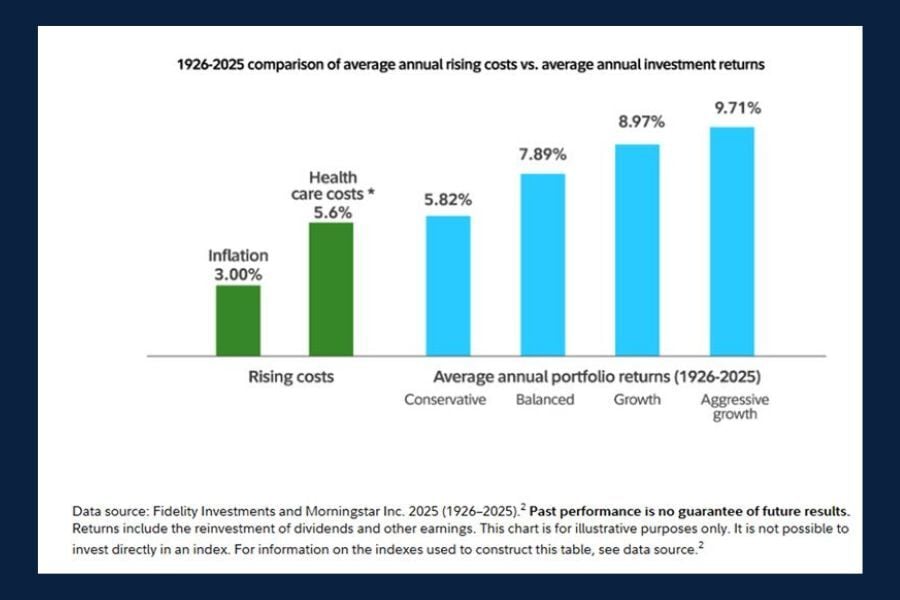
Today’s Chart of the Day from the blog Is $1 million enough to retire? by Fidelity explores a common retirement question: Is $1 million enough? Using..

Read More

 Infographic on overconfidence bias showing that 65% of Americans believe they have above-average intelligence and 73% believe they are above-average drivers.

Chart of the Day: Overconfidence Bias

Today’s Chart of the Day from Schwab Asset Management's blog, Overconfidence bias, highlights a well-known concept in behavioral finance:..

Read More

Chart of the Day: The Average Millionaire

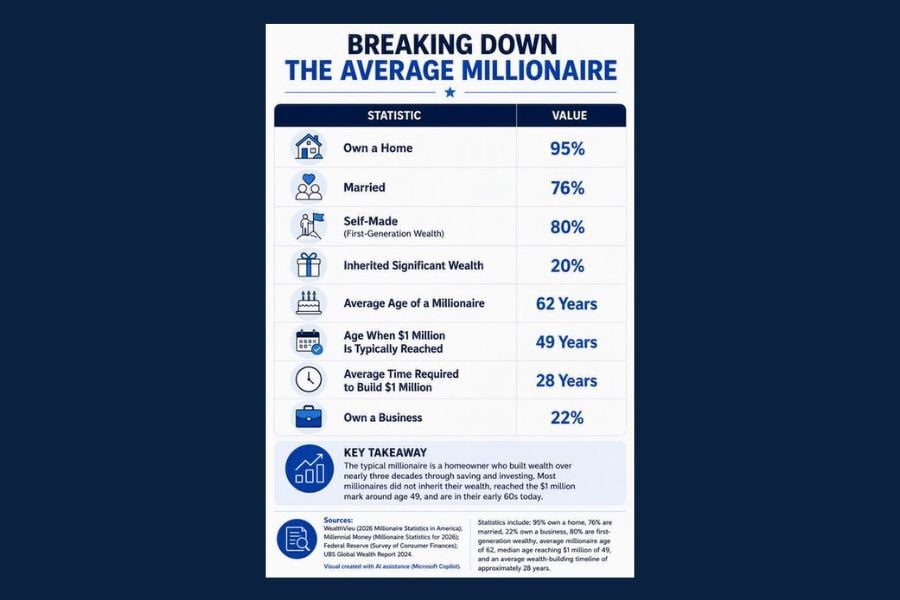
Today’s Chart of the Day pulls data from several sources to show what it really takes to become the average millionaire.

Read More

Chart of the Day: Women and Investing

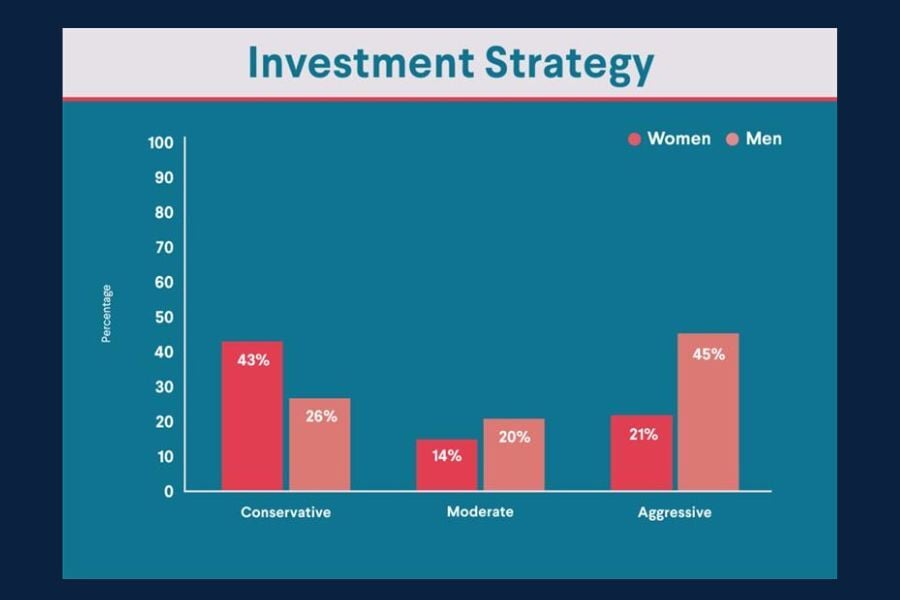
Today’s Chart of the Day from SoFi, Women and Investing: The 2026 Outlook, Strategies & Trend, breaks down the investment tendencies between men and..

Read More

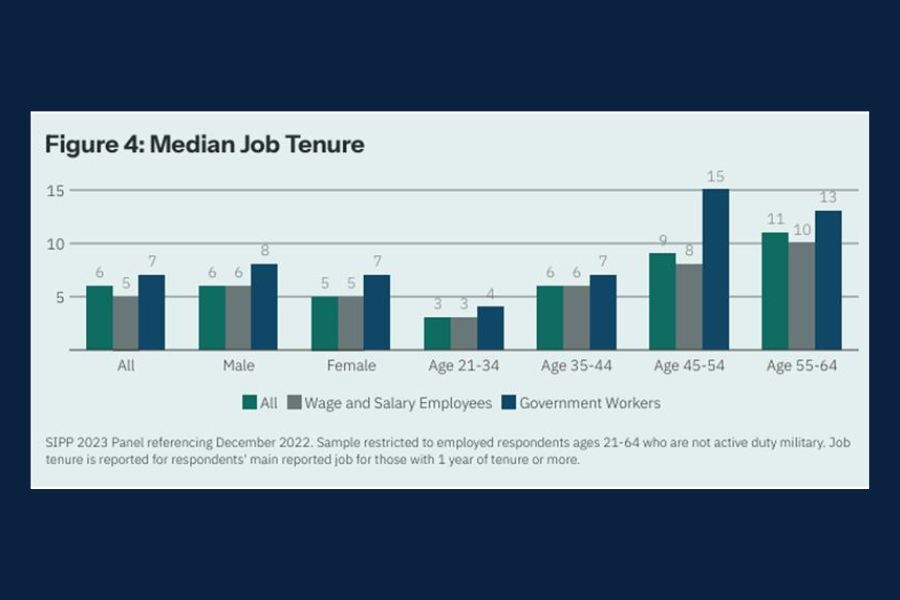
Bar graph comparing median job tenure by worker type and age; government workers have the longest tenure, reaching 15 years among ages 45 to 54.

Chart of the Day: Job Tenure

Today’s Chart of the Day, Retirement in America, from NIRS highlights how job tenure varies across age groups and employment sectors. Younger workers..

Read More

 Bar chart showing the percentage of 8,600 U.S. respondents between the ages of 18-65 who use or own financial products.

Chart of the Day: Americans Trust Savings Account

Today’s Chart of the Day from Statista's, Americans Trust the Savings Account, shows that Americans overwhelmingly favor savings accounts, with 45%..

Read More

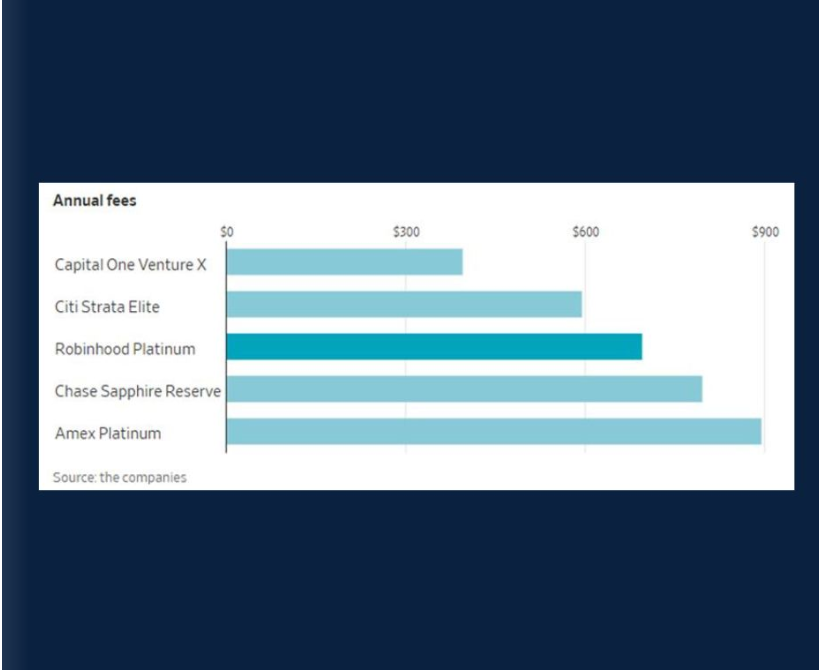
Chart of the Day: Annual Fees

Today's Chart of the Day, featured in The Wall Street Journal article Exclusive | Robinhood Revamps $695 Platinum Card After Customers Take Issue..

Read More

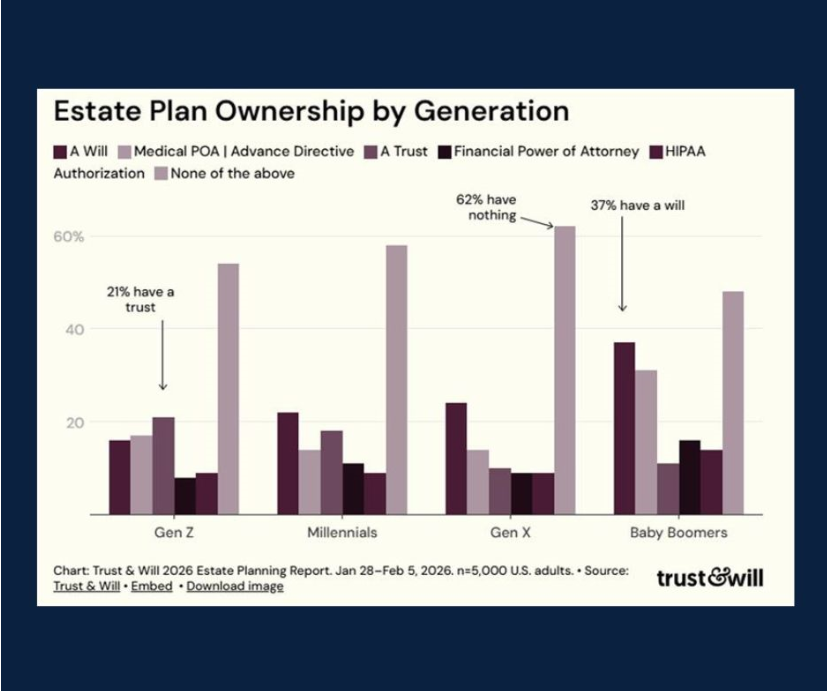
Chart of the Day: Estate Plan Ownership

Today’s Chart of the Day comes Trust & Will's 2026 Estate Planning Report: Key Findings and Trends and breaks down estate planning participation..

Read More

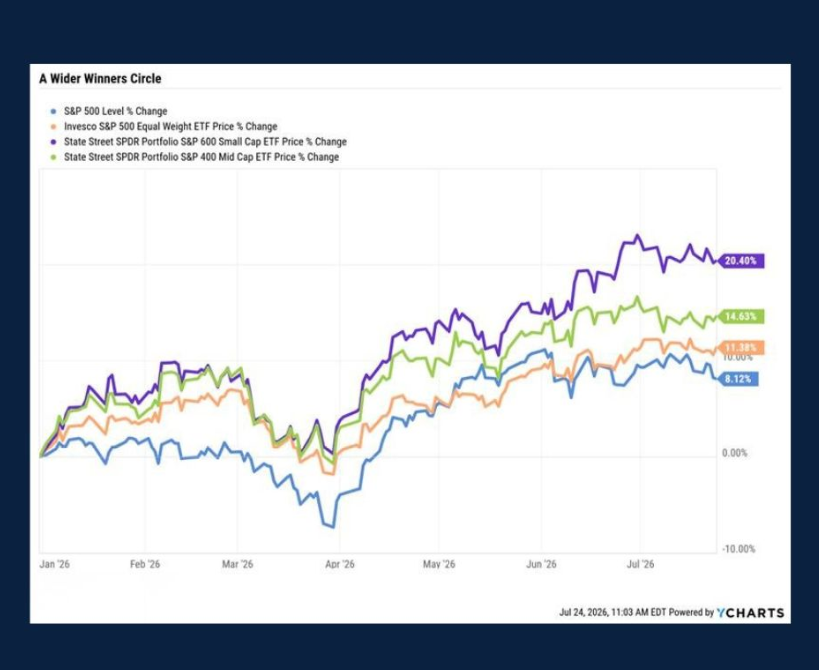
Chart of the Day: Wider Winners Circle

Today’s Chart of the Day created in YCharts with data from Morningstar compares the performance of the S&P 500 with small-cap, mid-cap, and..

Read More

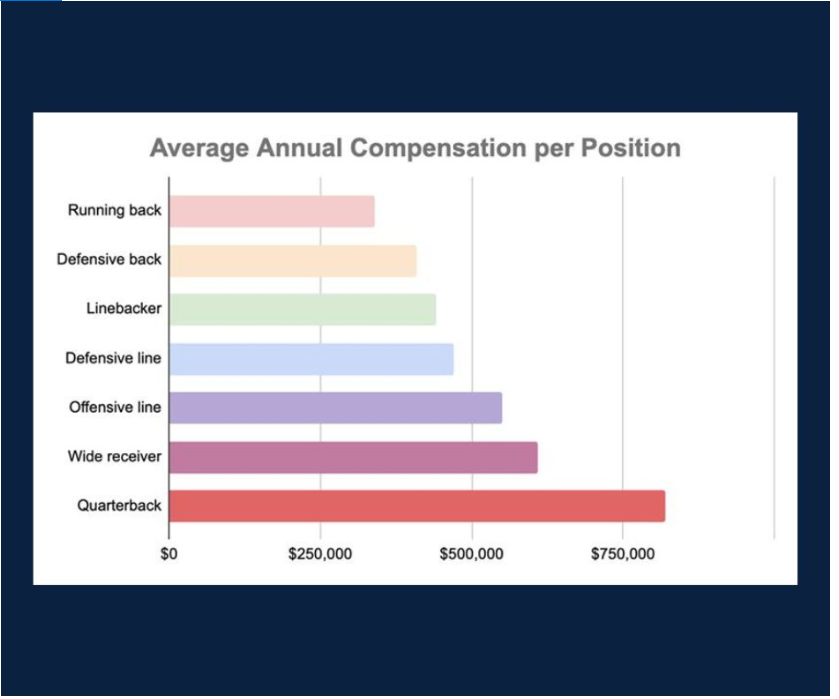
Chart of the Day: NIL College Compensation

With the return of college football, Saturdays across the country are loud and rowdy yet again. Today’s Chart of the Day from Crystal Capital..

Read More

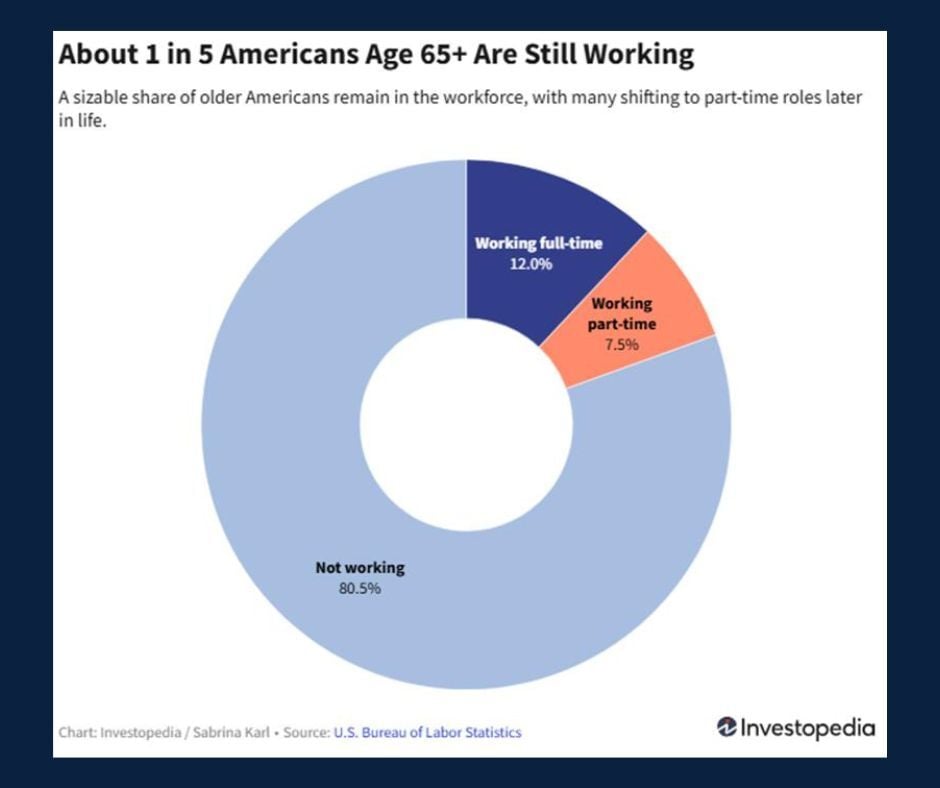
Chart of the Day: Working Past 65

Today’s Chart of the Day from Investopedia's blog How Many Americans Work Past 65? Changing Retirement by the Numbers shows that roughly 20% of..

Read More

John Keefer, Portfolio Manager

John joined Crews Bank & Trust as a Trust Investment Associate in September 2025 and was promoted to Portfolio Manager in 2026. He holds a Bachelor of Science in Business Administration with a focus in Finance and Banking from the University of Missouri, along with an Investment Certificate. In his role, he supports portfolio maintenance and analysis while helping clients work toward their financial goals.

Investments are not a deposit or other obligation of, or guaranteed by, the bank, are not FDIC insured, not insured by any federal government agency, and are subject to investment risks, including possible loss of principal. Past performance is not indicative of future results.

Recent Posts

Chart of the Day: S&P 500 Net Profit

Today’s Chart of the Day from Charlie Bilello's Blog, The State of the Markets (August 2026), highlights a sharp rise in S&P 500 profit margins after several years of relatively steady figures in the 11% to 13% range.

More

Chart of the Day: Invested Wealth

Today’s Chart of the Day from Visa's The great wealth transfer reality check estimates that a significant percentage of wealth transferred over the next 20 years will remain invested across a variety of assets like stocks, bonds and property. The smaller portion of the wealth transfer is expected to drive spending and stimulate the economy.

More

Chart of the Day: Nvidia Keeps Winning

Today’s Chart of the Day from Yahoo Finance on Instagram breaks down Nvidia’s most recent earnings report for Q2 2026.

More

Chart of the Day: Growth of $1

Today's Chart of the Day from Clearnomics' 10 Charts on the 2026 Mid-Year Market Outlook reveals the power of compounding over the past century.

More

Chart of the Day: Is a Million Dollars Enough?

Today’s Chart of the Day from the blog Is $1 million enough to retire? by Fidelity explores a common retirement question: Is $1 million enough? Using historical market performance and portfolio allocations compared to inflation and rising health care costs, the answer may vary.

More

Chart of the Day: Overconfidence Bias

Today’s Chart of the Day from Schwab Asset Management's blog, Overconfidence bias, highlights a well-known concept in behavioral finance: overconfidence bias, or our tendency to think we’re better at things than we actually are.

More

Chart of the Day: The Average Millionaire

Today’s Chart of the Day pulls data from several sources to show what it really takes to become the average millionaire.

More

Chart of the Day: Women and Investing

Today’s Chart of the Day from SoFi, Women and Investing: The 2026 Outlook, Strategies & Trend, breaks down the investment tendencies between men and women.

More

Chart of the Day: Job Tenure

Today’s Chart of the Day, Retirement in America, from NIRS highlights how job tenure varies across age groups and employment sectors. Younger workers tend to have shorter job tenure, while older workers, especially in government positions, typically remain with the same employer longer.

More

Chart of the Day: Americans Trust Savings Account

Today’s Chart of the Day from Statista's, Americans Trust the Savings Account, shows that Americans overwhelmingly favor savings accounts, with 45% of respondents reporting that they own or use one. Their popularity likely comes down to simplicity, safety, and easy access to cash when needed.

More

Chart of the Day: Annual Fees

Today's Chart of the Day, featured in The Wall Street Journal article Exclusive | Robinhood Revamps $695 Platinum Card After Customers Take Issue With Perks compares annual fees for some of the most popular premium credit cards.

More

Chart of the Day: Estate Plan Ownership

Today’s Chart of the Day comes Trust & Will's 2026 Estate Planning Report: Key Findings and Trends and breaks down estate planning participation across generations, revealing some surprising results.

More

Chart of the Day: Wider Winners Circle

Today’s Chart of the Day created in YCharts with data from Morningstar compares the performance of the S&P 500 with small-cap, mid-cap, and equal-weighted indexes through July. After leading the market for several years, the S&P 500 has taken a back seat in 2026. That’s not a knock on its performance, as an 8% gain is still in line with its long-term average, but rather a reflection of the strong returns coming from smaller companies.

More

Chart of the Day: NIL College Compensation

With the return of college football, Saturdays across the country are loud and rowdy yet again. Today’s Chart of the Day from Crystal Capital Partners' blog NIL College Football Poised for a $2.5 Billion Valuation highlights the average NIL (Name, Image and Likeness) compensation across different positions on the turf.

More

Chart of the Day: Working Past 65

Today’s Chart of the Day from Investopedia's blog How Many Americans Work Past 65? Changing Retirement by the Numbers shows that roughly 20% of American’s Americans aged 65+ years remain in the workforce.

More