
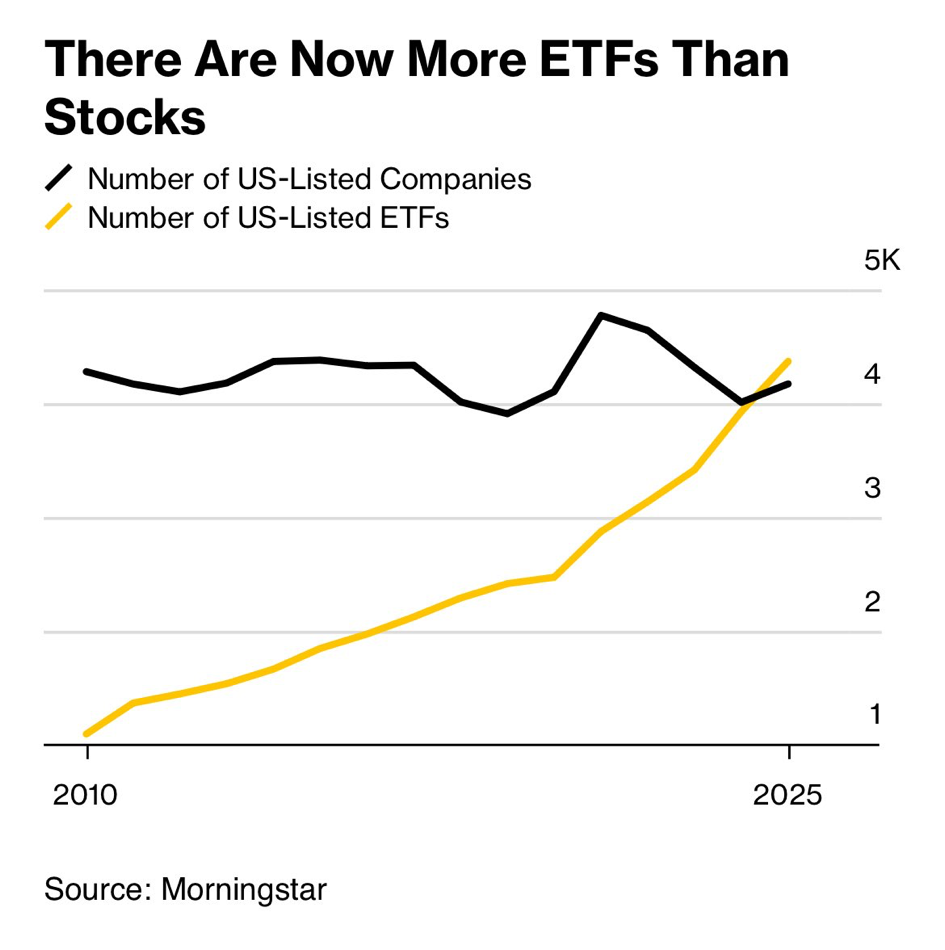
Chart of the Day: EFTs > Stocks
Today’s Chart of the Day shows that there are now more ETFs (Exchange Traded Funds) than stocks.
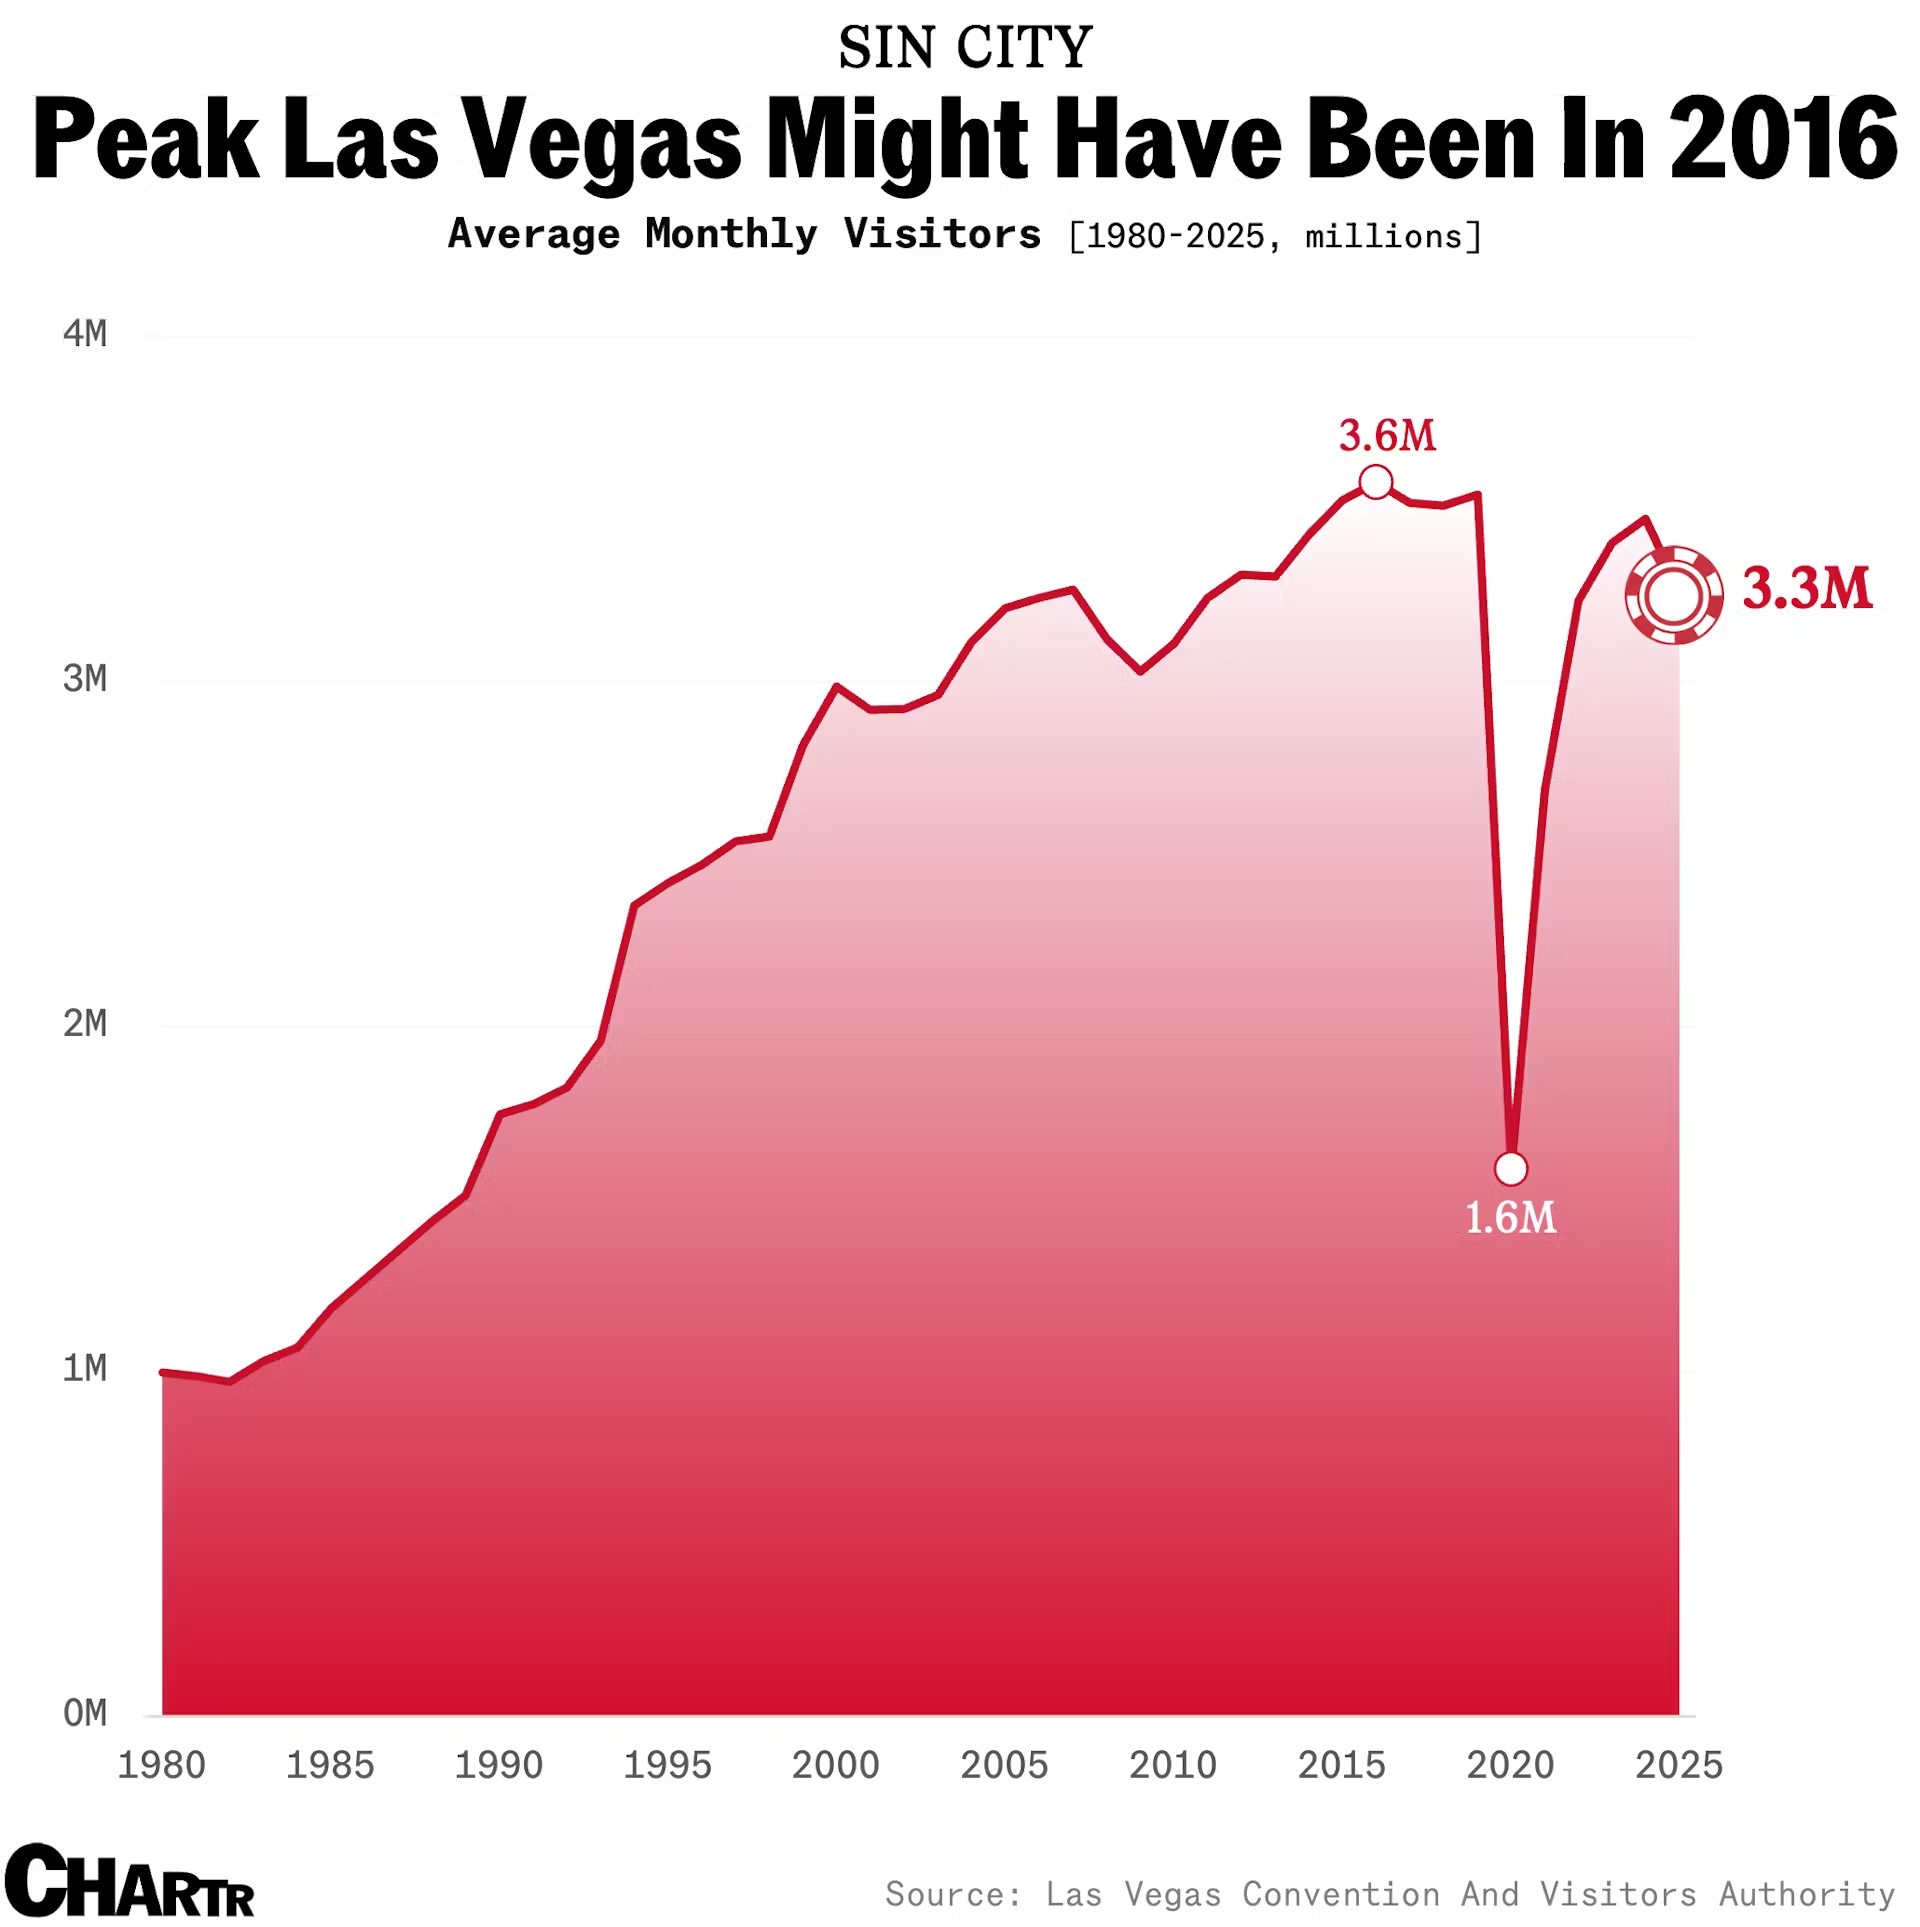
Chart of the Day: Peak Vegas in 2016
Today’s Chart of the Day is from Chartr and shows that the number of monthly visitors to Las Vegas has declined.
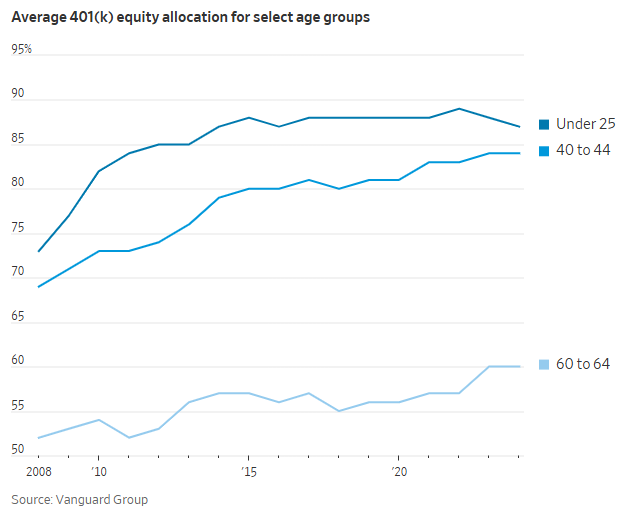
More Stocks Than Ever in 401(k)
Today’s Chart of the Day is from The Wall Street Journal, in an article titled “Americans’ 401(k)s Are More Tied to Stocks Than Ever.”
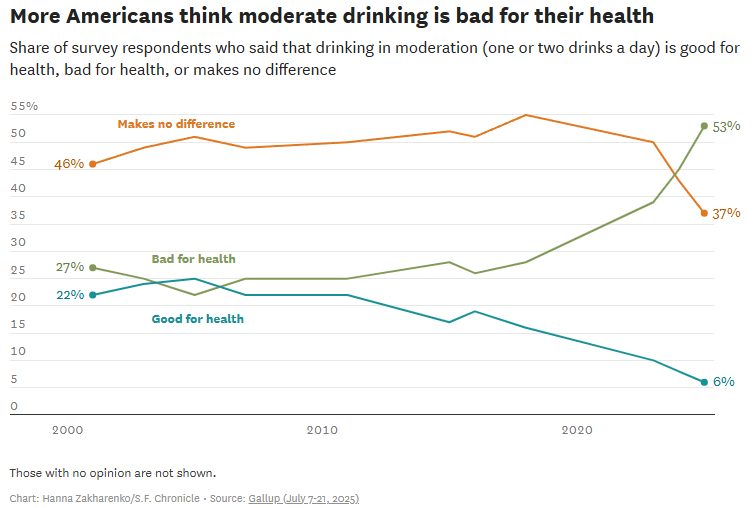
Chart of the Day: Alcohol Attitudes
Today’s Chart of the Day is from the San Francisco Chronicle with a Gallup poll showing that since 2000, attitudes about alcohol consumption have..
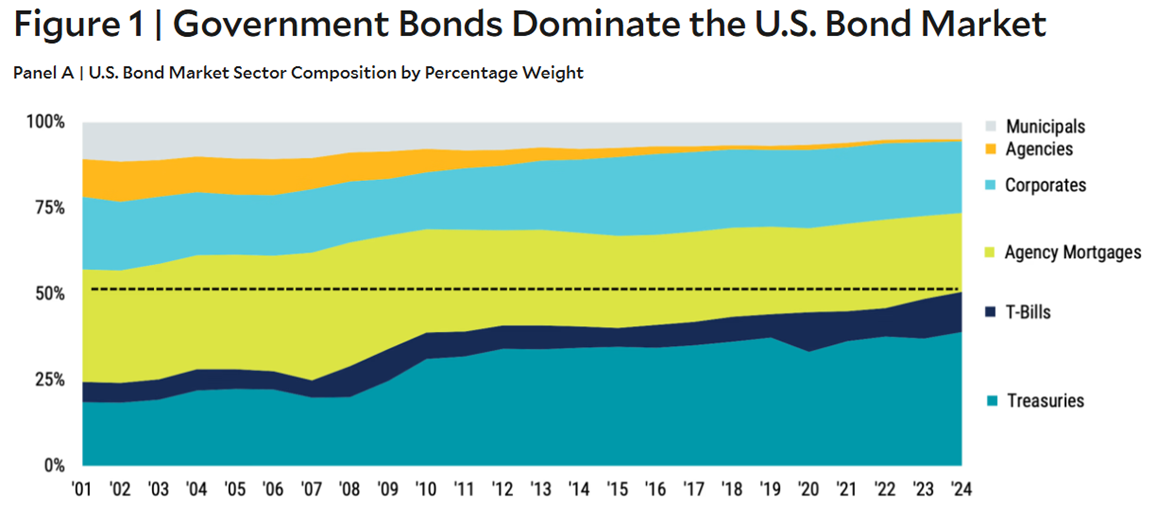
Chart of the Day: Government Bonds Dominate the US Bond Market
Today’s Chart of the Day is from Avantis Investors and shows the weighted percentage of bonds issued by various sectors of the market.

Chart of the Day: AI and Compatible Jobs
Today’s Chart of the Day is from a study by Cornell University (arXiv.org) published in July 2025, called “Working with AI: Measuring the..
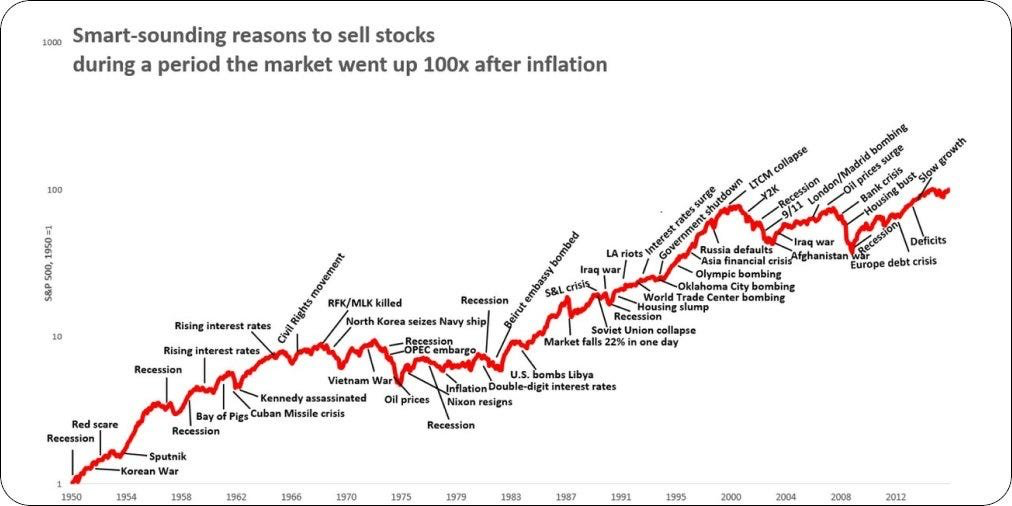
Chart of the Day: Reasons to Sell
Today’s Chart is from @QCompounding showing 50+ "smart-sounding" reasons used to sell stocks since 1950 to 2020, all while the market went up 100(x)..
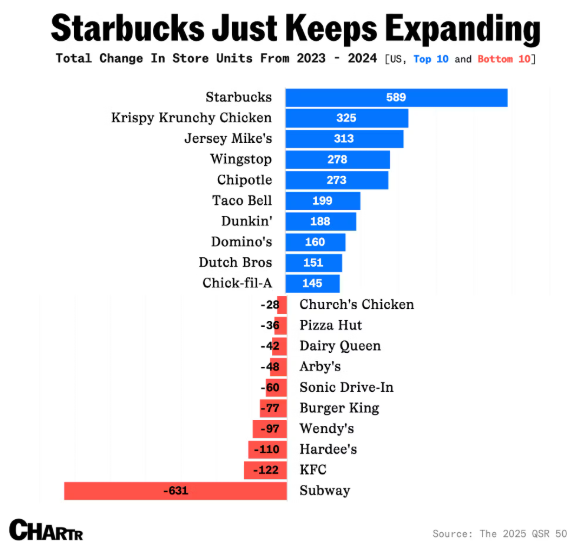
Chart of the Day: Starbucks for the Win
Today’s Chart of the Day is from Chartr and confirms you are not imaging things while driving around. Yes, you are seeing more and more Starbucks pop..
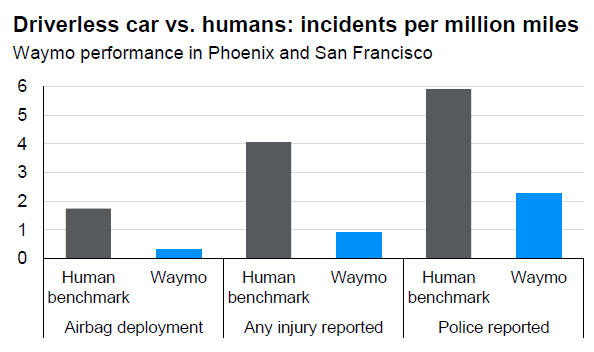
Chart of the Day: Driver vs. Driverless Cars
Today’s Chart of the Day is from a Waymo*/Stanford report shared by JP Morgan that shows the “incidents per million miles" comparing human drivers,..