
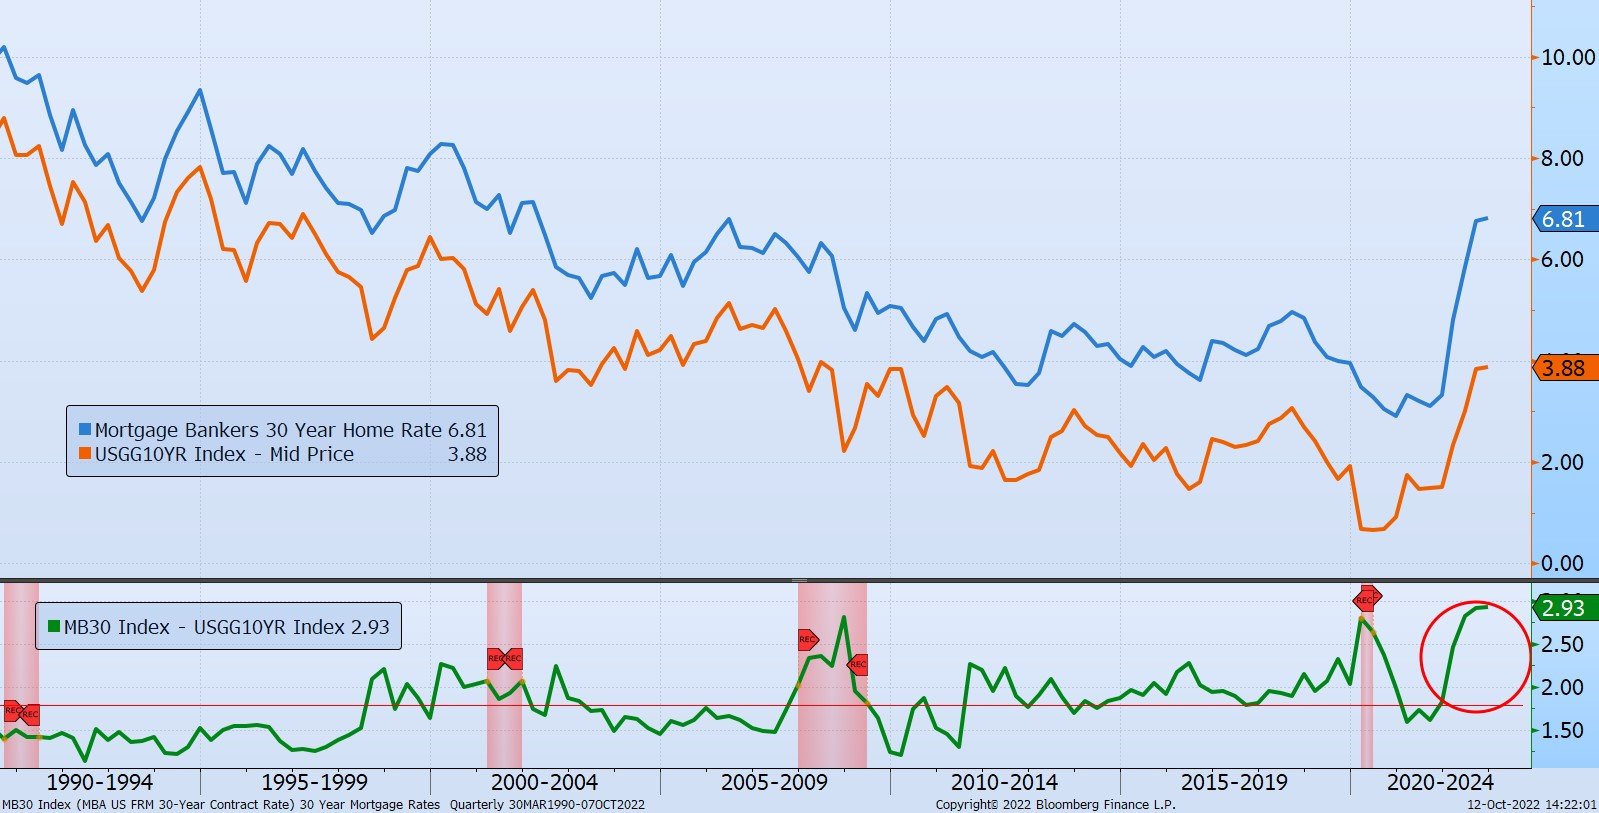
Elevated Premiums in Mortgages
The history of the Mortgage Banker’s 30-Year Home Rate, in blue, going all the way back to when they started the index in 1990 is displayed in today's Chart of the Day.
The history of the Mortgage Banker’s 30-Year Home Rate, in blue, going all the way back to when they started the index in 1990 is displayed in..
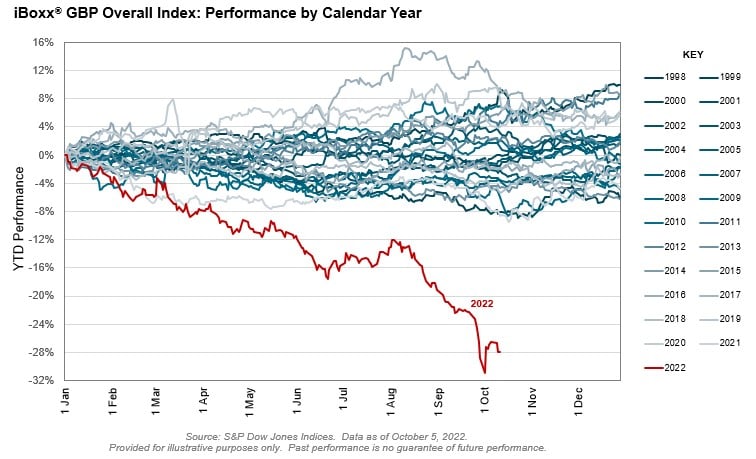
The Chart of the Day is from S&P Global. As eternal optimists, which has worked for our clients over the last 20+ years, we like to say, “It could..
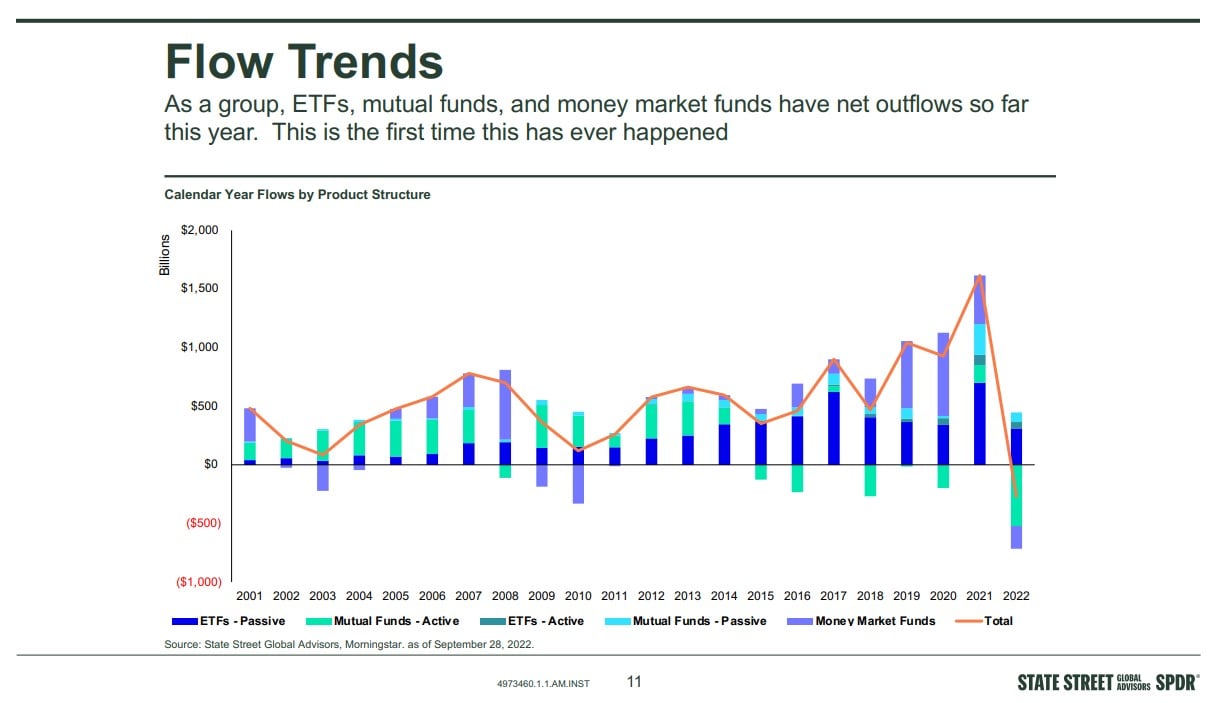
The following Chart of the Day from State Street Global Advisors shows the flow of funds in investments going all the way back to 2001.
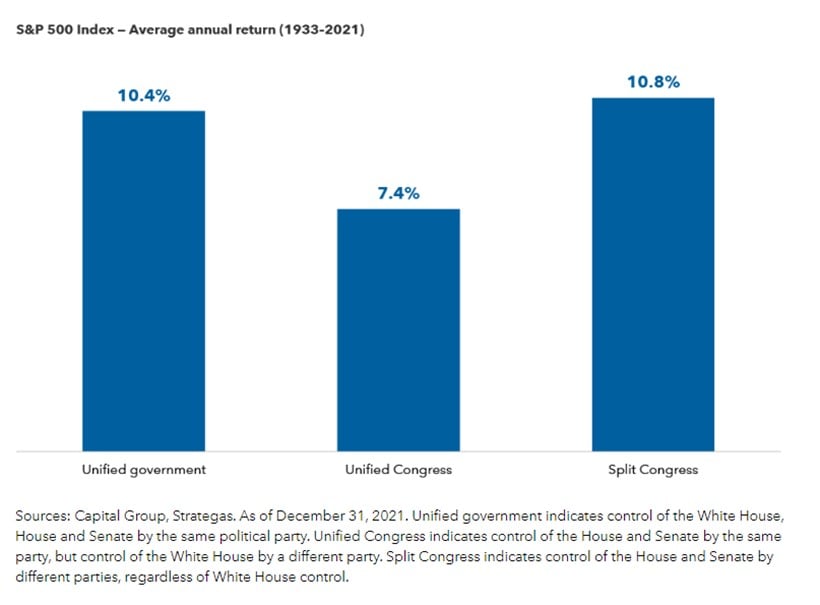
Today's Chart of the Day is a second chart from the Capital Group article called “Can midterm elections move markets?”
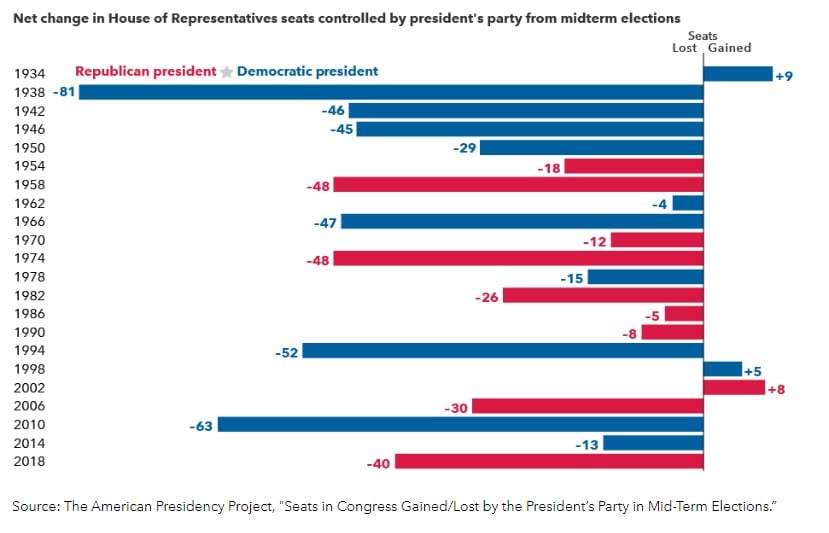
Today’s Chart of the Day comes from a Capital Group article called “Can midterm elections move markets?”
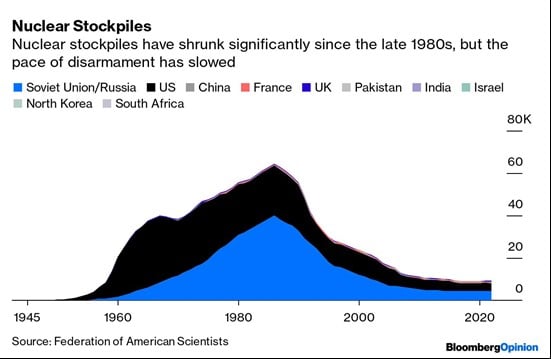
Today’s Chart of the Day from Bloomberg shows that though there are less nuclear stockpiles than the 1980’s, there are still too many. There is an..
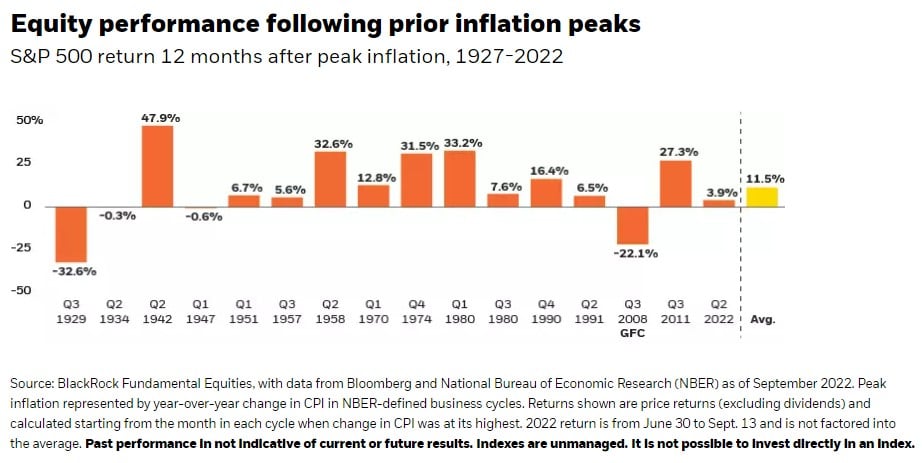
Today's Chart of the Day is in a BlackRock article. This is the organization who issues the iShares Exchange Traded Funds (ETFs) in our portfolios.
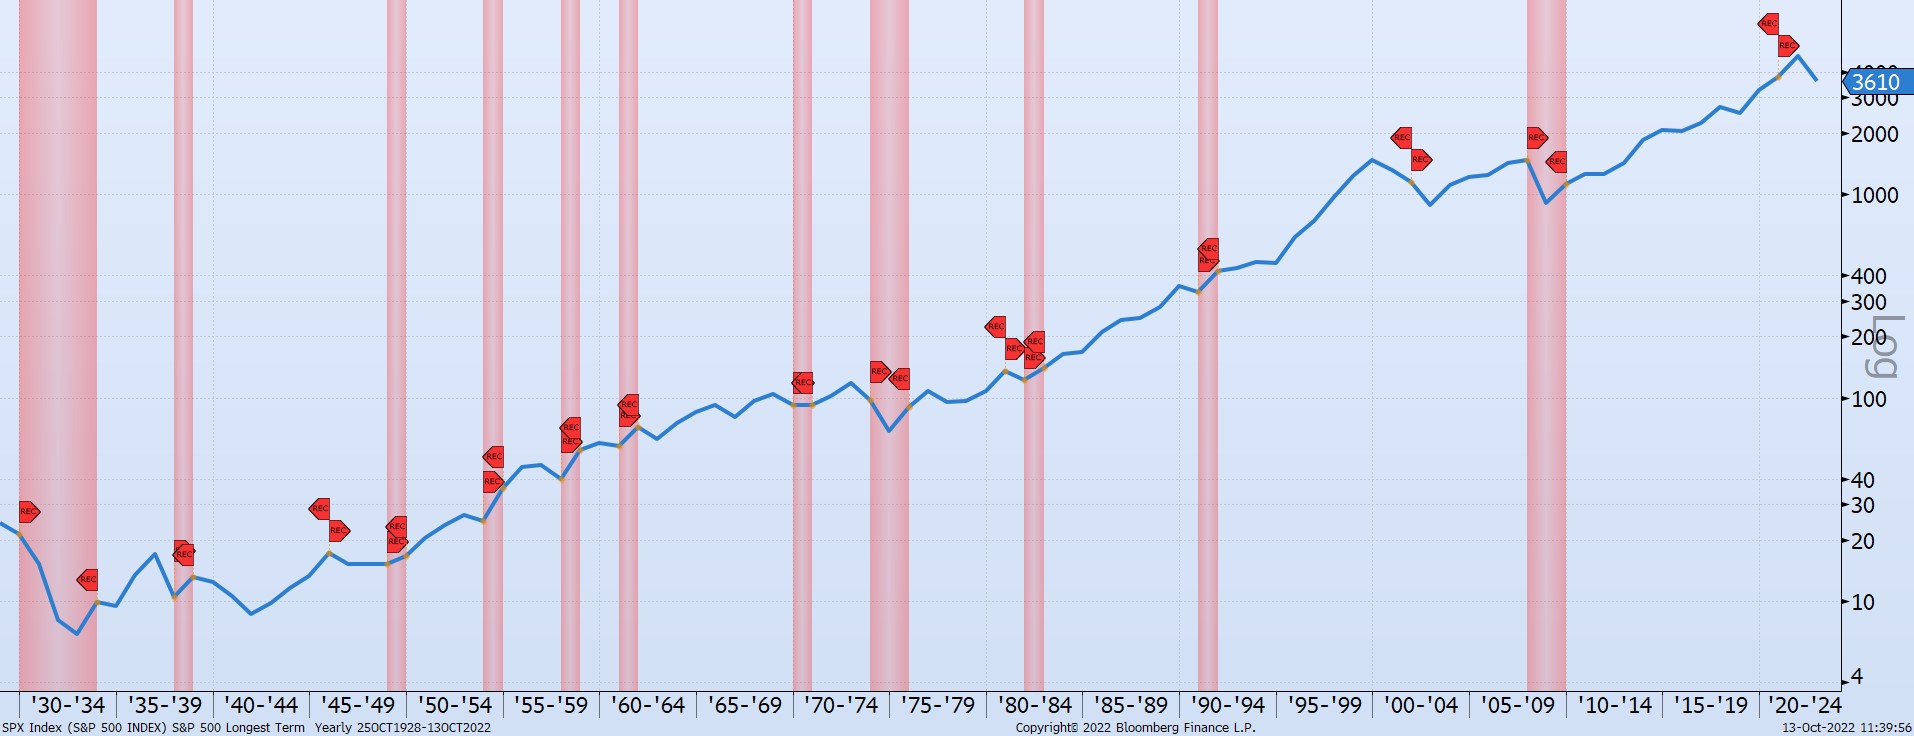
Today’s Chart of the Day shows the S&P 500 index with recessions marked in red going all the way back to 1928.
So far this year, we have experienced the longest “downturn” in terms of time since our last record high during The Great Recession.
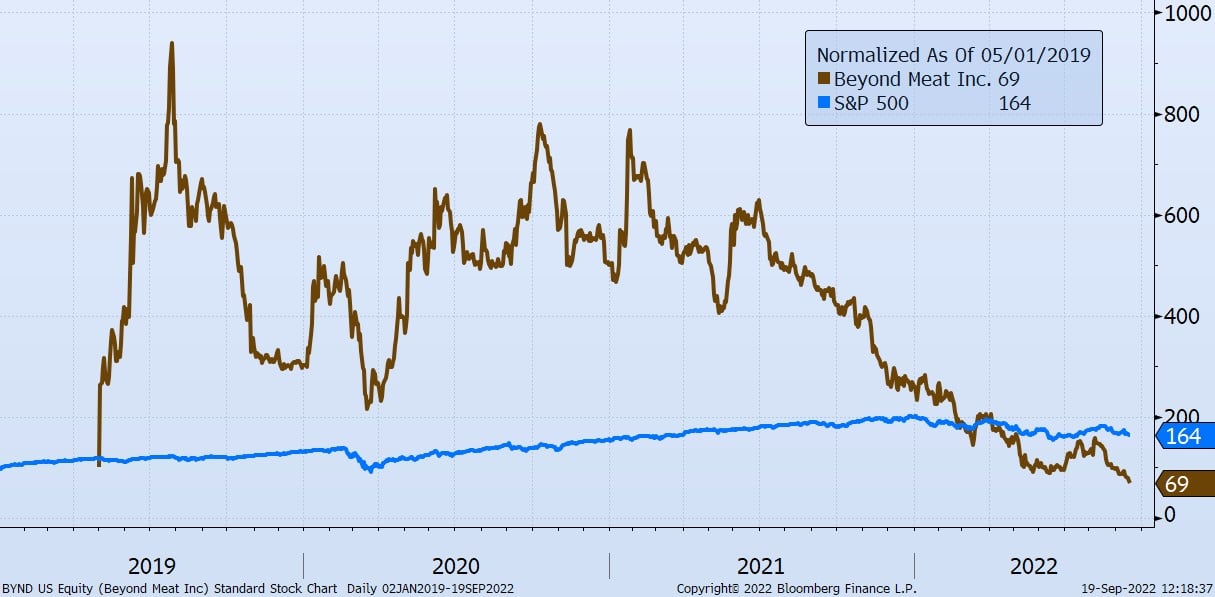
Today’s Chart of the Day shows the price of $100 invested in Beyond Meat, Inc. when the company went public in early 2019.
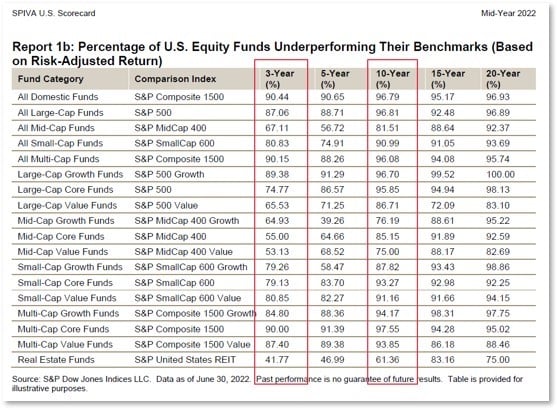
Twice a year, S&P Dow Jones updates their SPIVA (S&P Indices Versus Active) report.
Today’s Chart of the Day comes from S&P Dow Jones Indices.
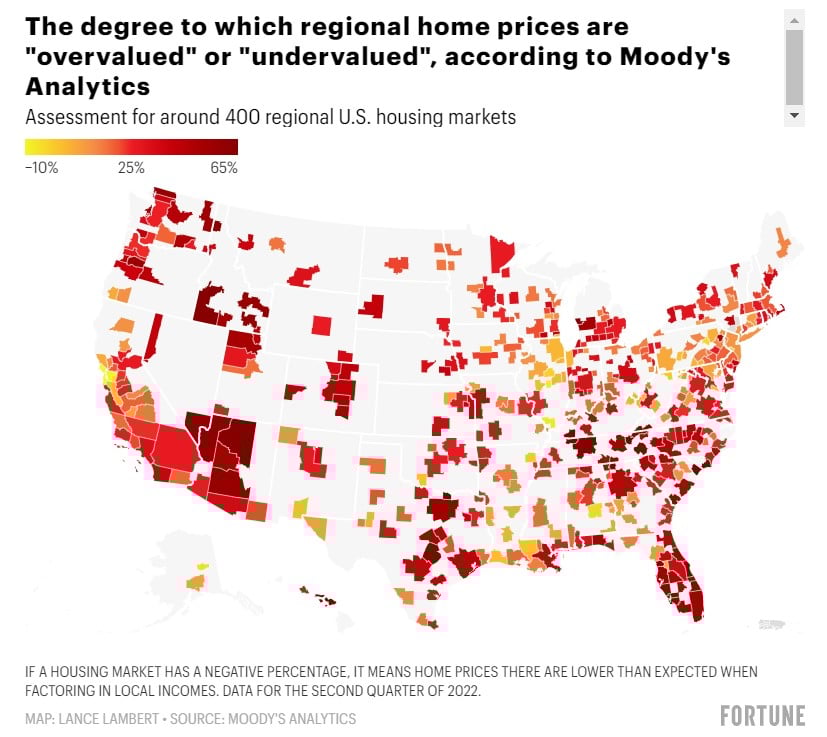
Today’s chart comes from Fortune, which shows the real estate markets that are “overvalued” based on the area's local incomes and construction costs.
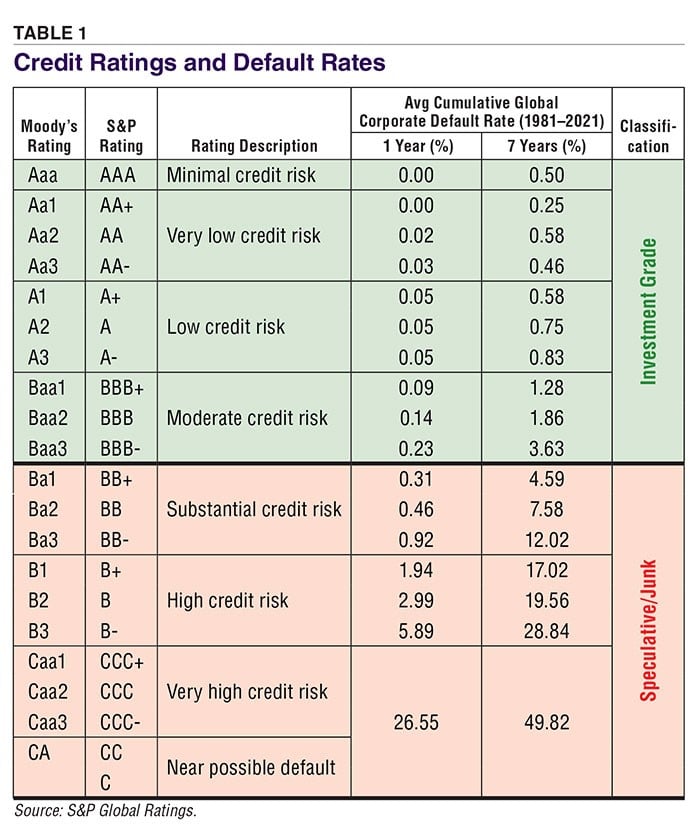
Today's Chart of the Day comes from an article in AAII.com (American Association of Individual Investors) and shows the average cumulative global..
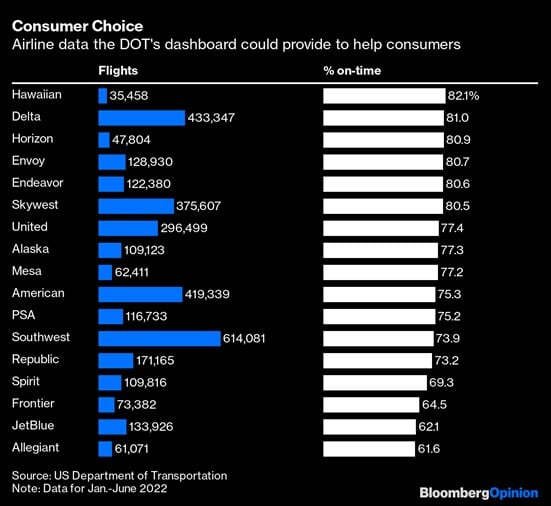
The Chart of the Day comes from Bloomberg. It's not a necessarily a financial chart, but instead shows percentages of on-time flights, and the amount..