
Chart of the Day: Five Years in Real Estate
Today’s Chart of the Day comes from John Burns and shows the historical percentages of homes sold by sales price going back to 2010.
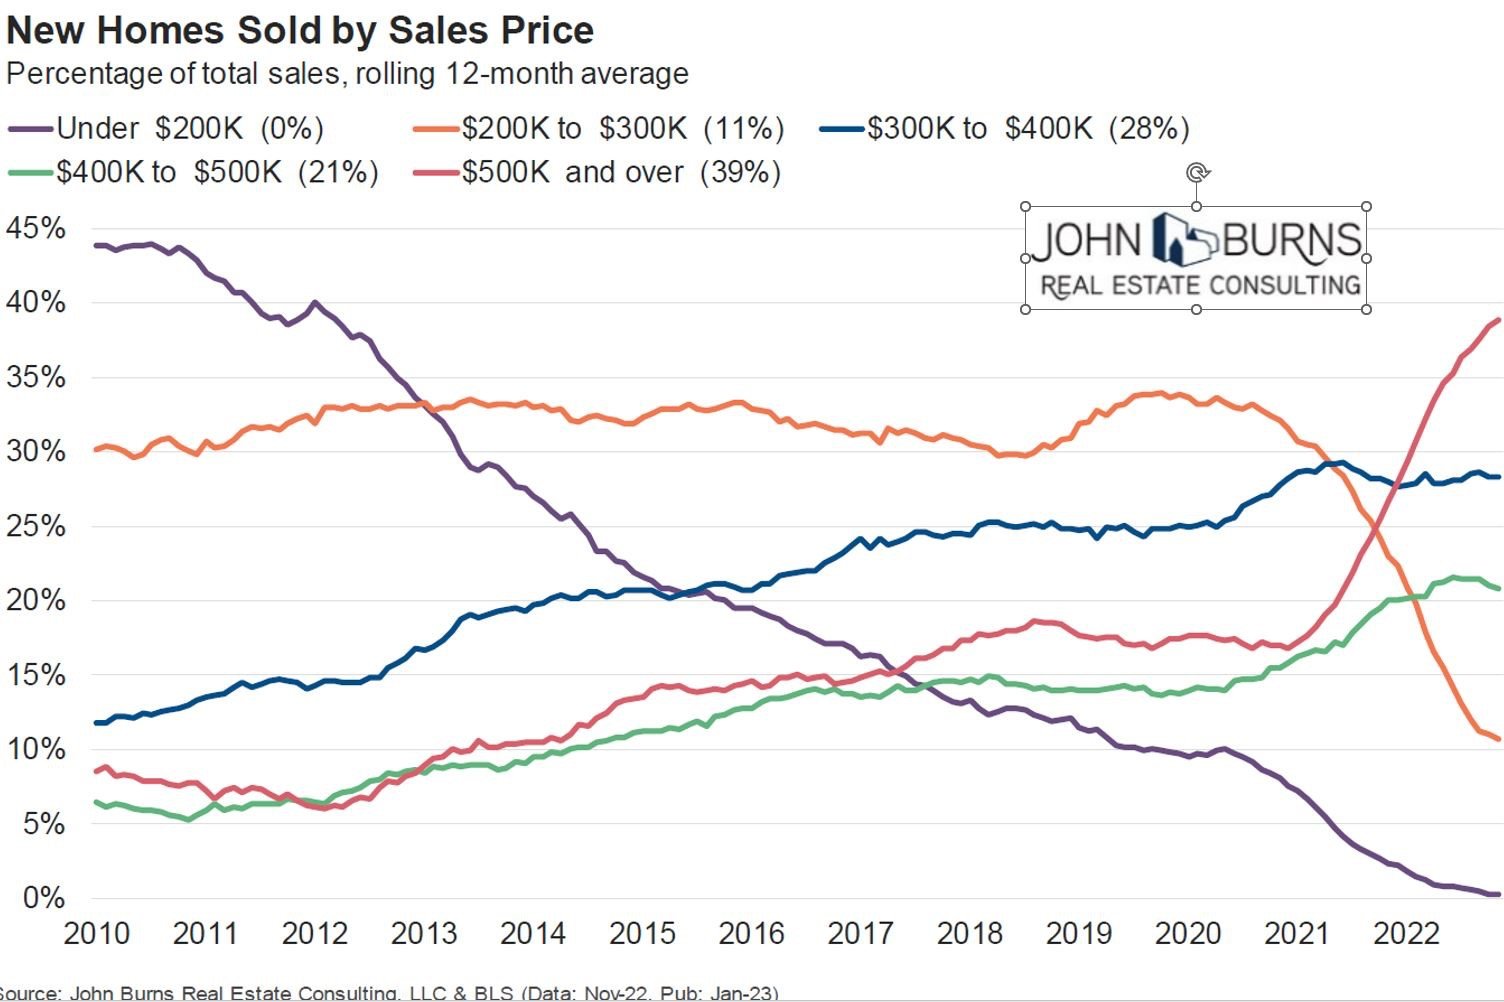
Today’s Chart of the Day comes from John Burns and shows the historical percentages of homes sold by sales price going back to 2010.
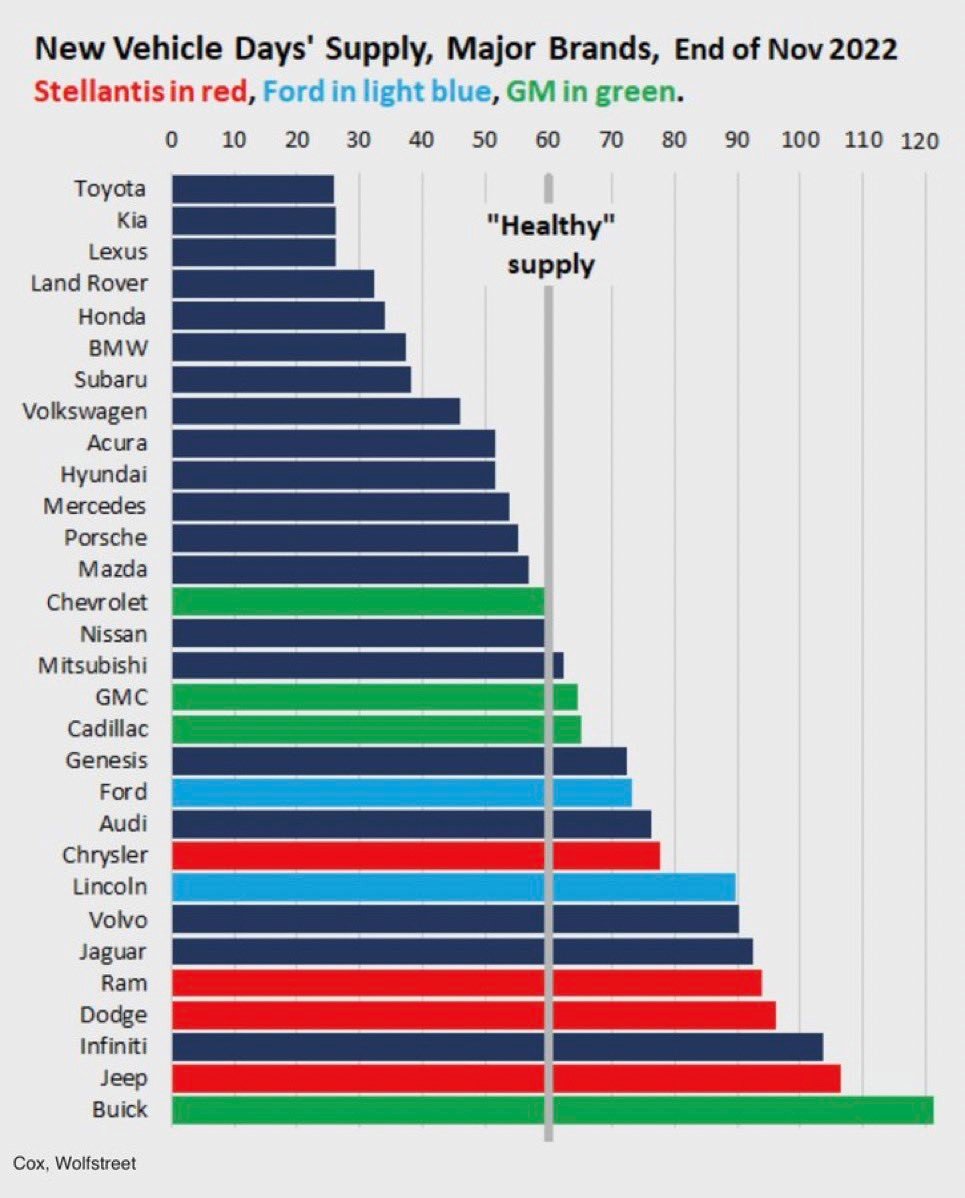
Today’s Chart of the Day comes from Wolfstreet and shows the supply of new vehicles in number of days.
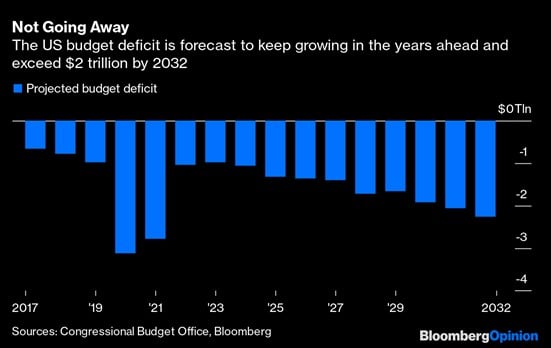
Today’s Chart of the Day is the projected budget deficits for the next 10 years provided by the Congressional Budget Office. It is not a rosy picture.
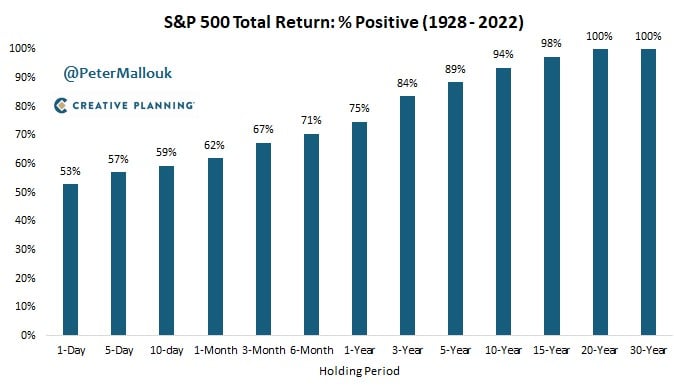
Today’s Chart of the Day comes from @PeterMallouk on Twitter and shows the percent of time the S&P 500 is positive, depending on your holding period,..

Today’s Chart of the Day is from the Federal Reserve Bank of St. Louis supporting the mantra, "Save early, Save often."

Today’s Chart of the Day comes from chartr with data provided by the United Nations.
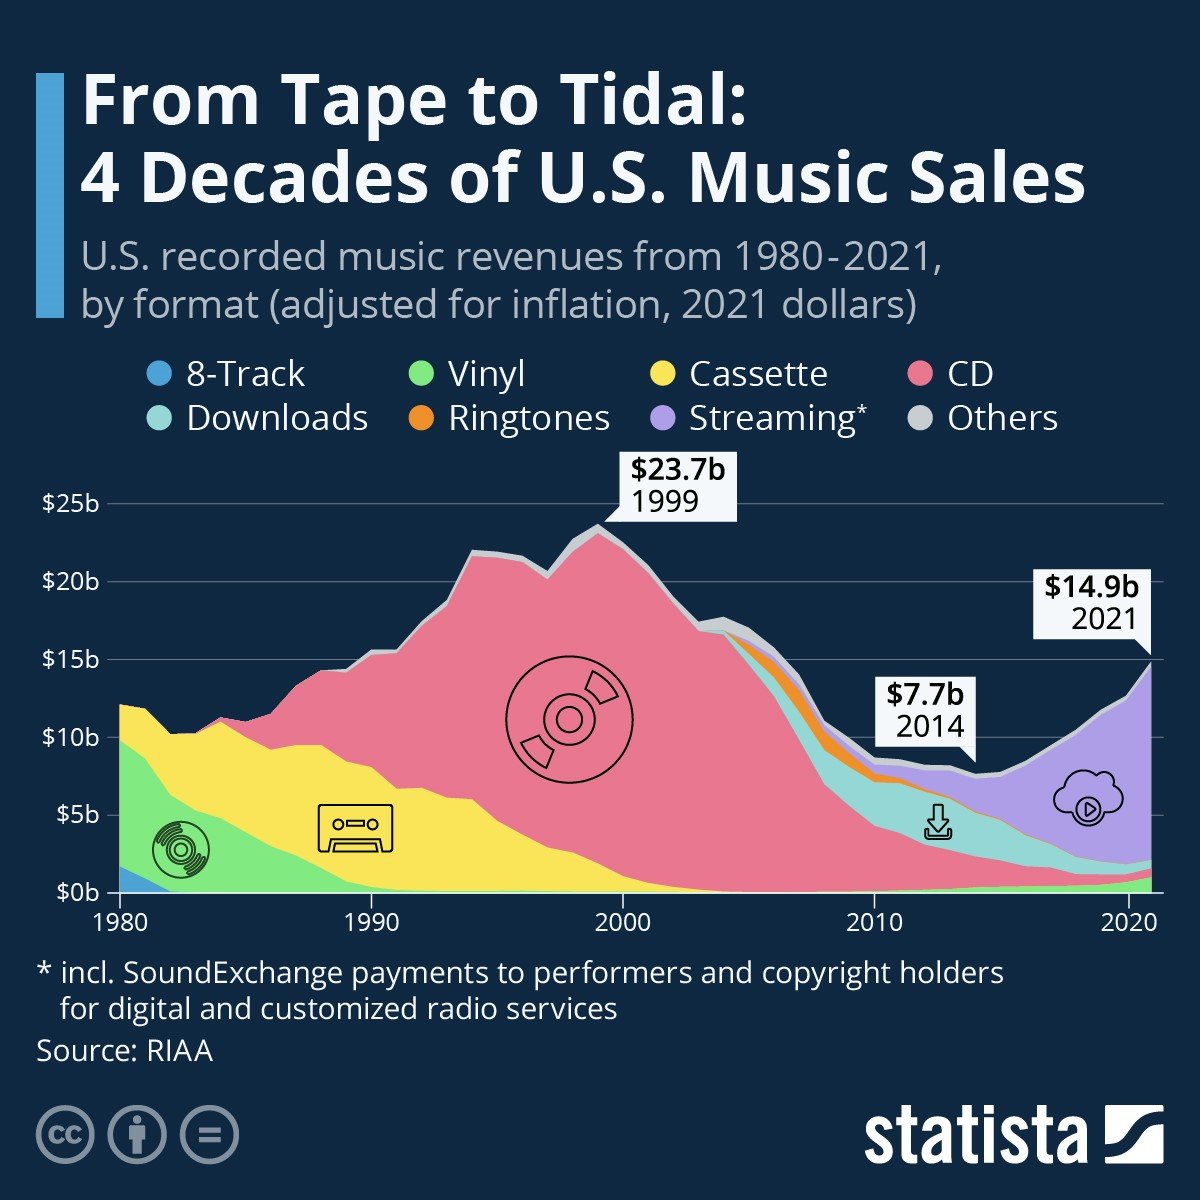
Today’s Chart of the Day comes from Statista, a provider of market and consumer data. The chart shows that streaming music, purple, has taken over..
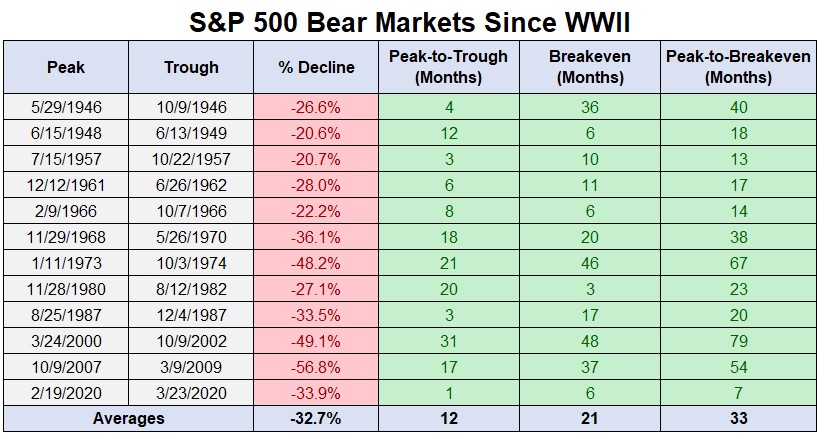
Today’s Chart of the Day comes from A Wealth of Commons Sense and shows the number of “bear markets,” years with a 20%+ loss, since World War II. We..
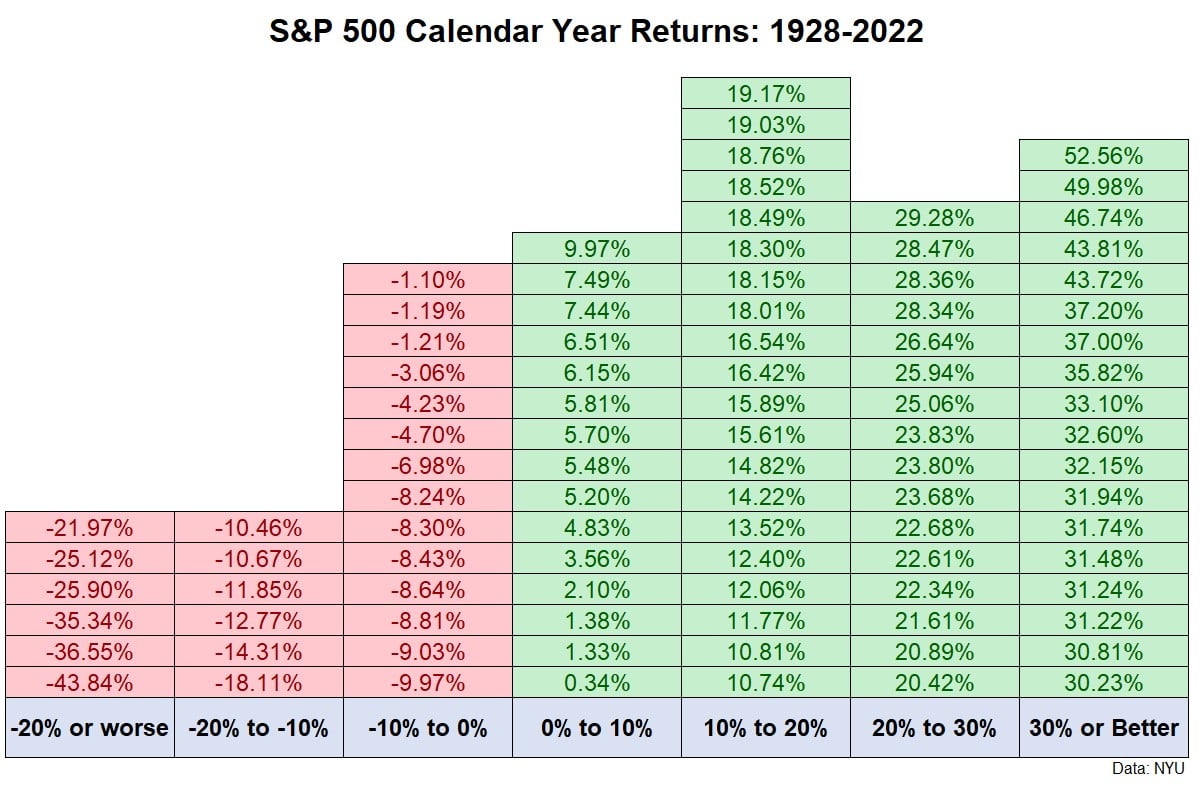
Today's Chart of the Day comes from A Wealth of Common Sense and shows the annual returns of the stock market since 1928. There were 69 positive..
Today’s Chart of the Day is a heads up from @Nickgerli1 on Twitter about the current state of home construction.
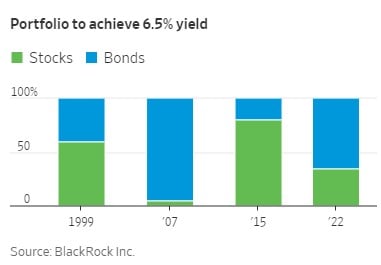
Today’s Chart of the Day comes from an article in the Wall Street Journal, “Bonds Over Stocks: The New 60-40 Portfolio.”
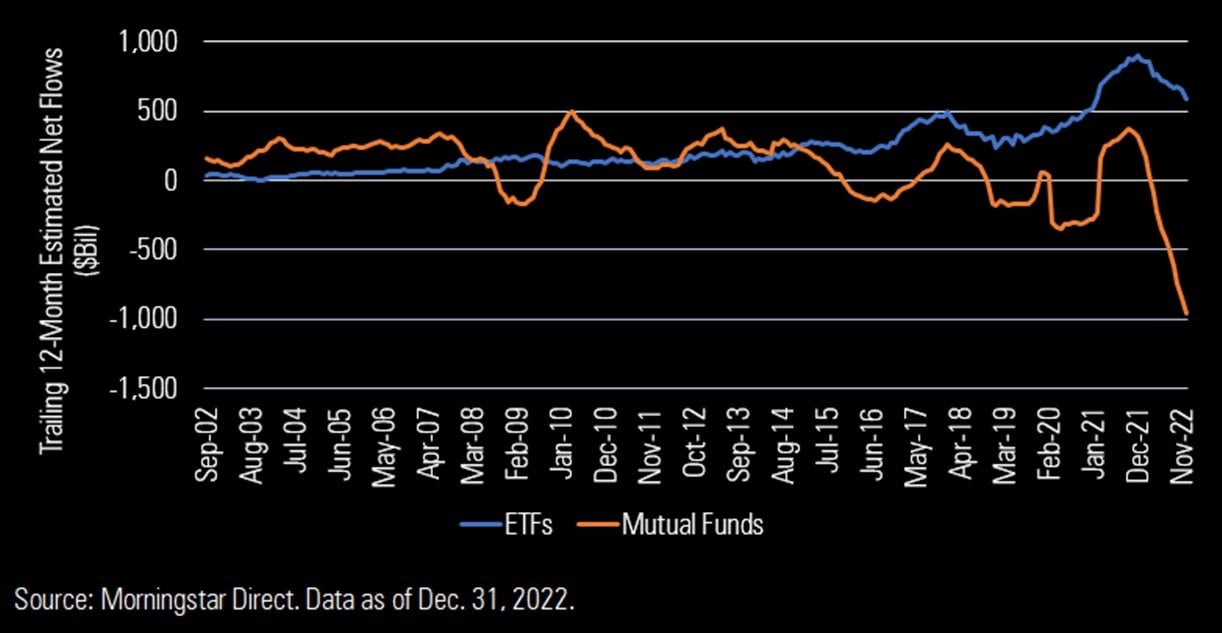
Today's Chart of the Day is from Morningstar, and shows that, during 2022, Exchange Traded Funds (aka ETFs) took in an impressive $500 billion in..
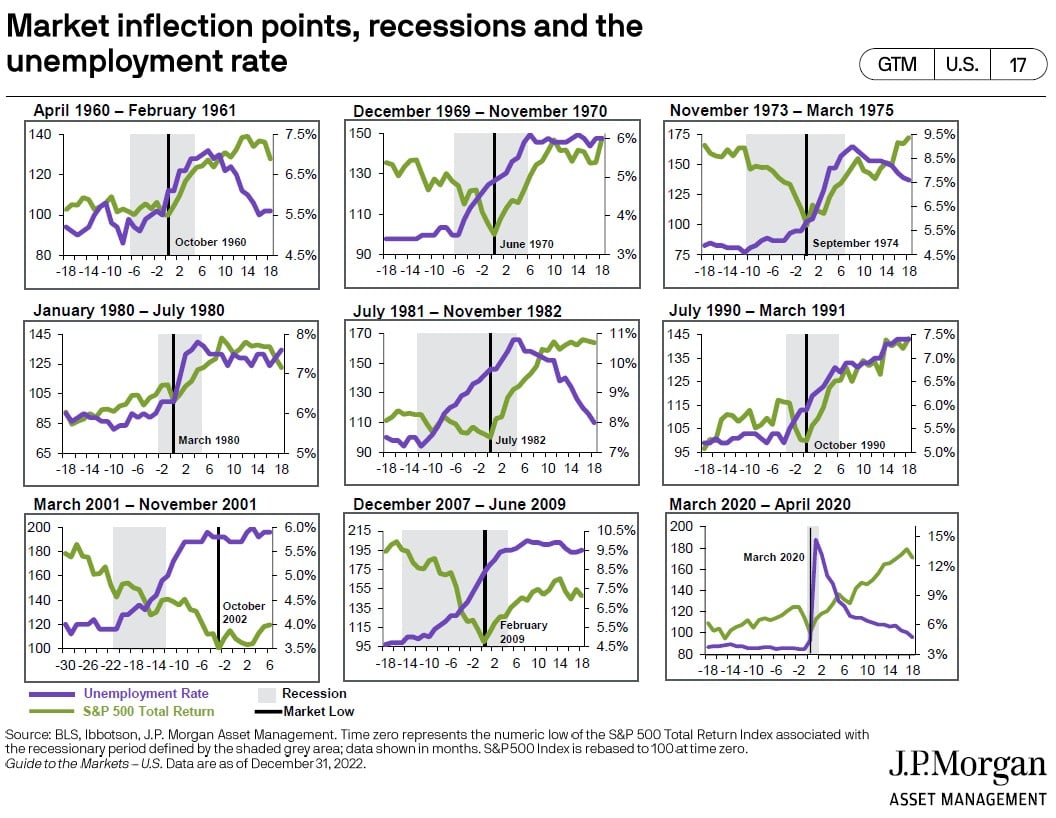
Today’s Chart of the Day comes from J.P. Morgan Asset Management. These charts show the last nine recessions, going all the way back to 1961,..
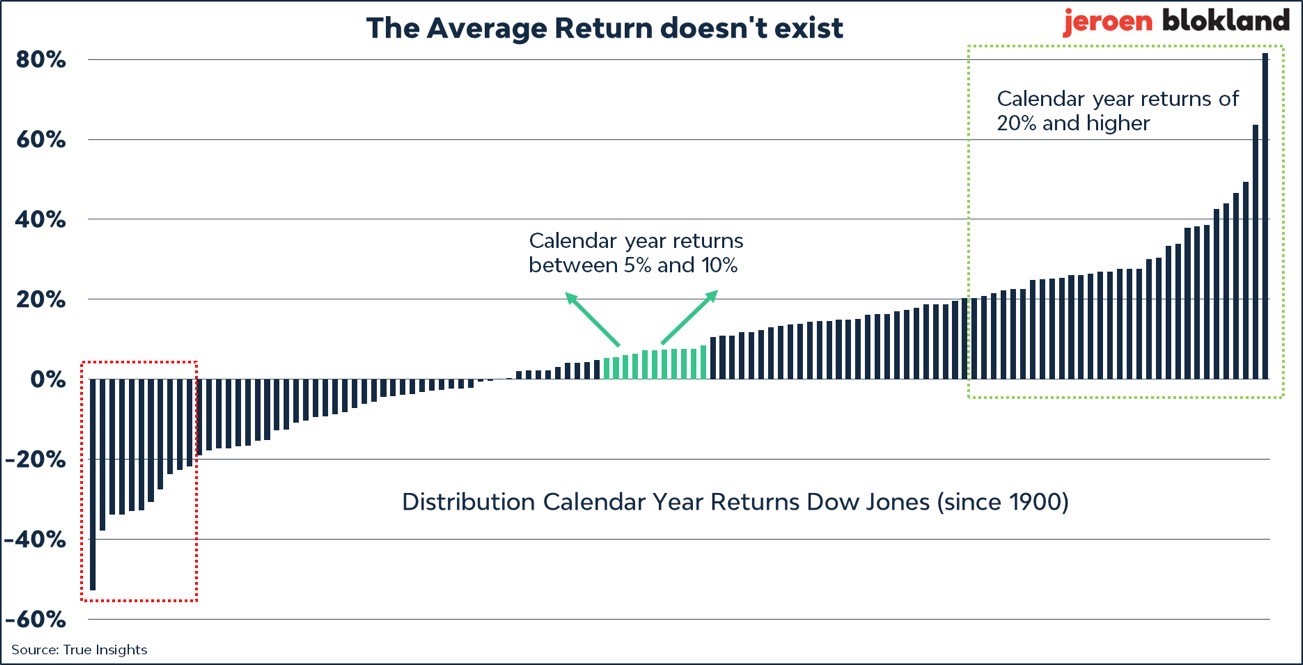
Today’s Chart of the Day from Jeroen Blokland, @jsblockland on Twitter, shows the distribution of one year of returns from the Dow Jones Industrial..
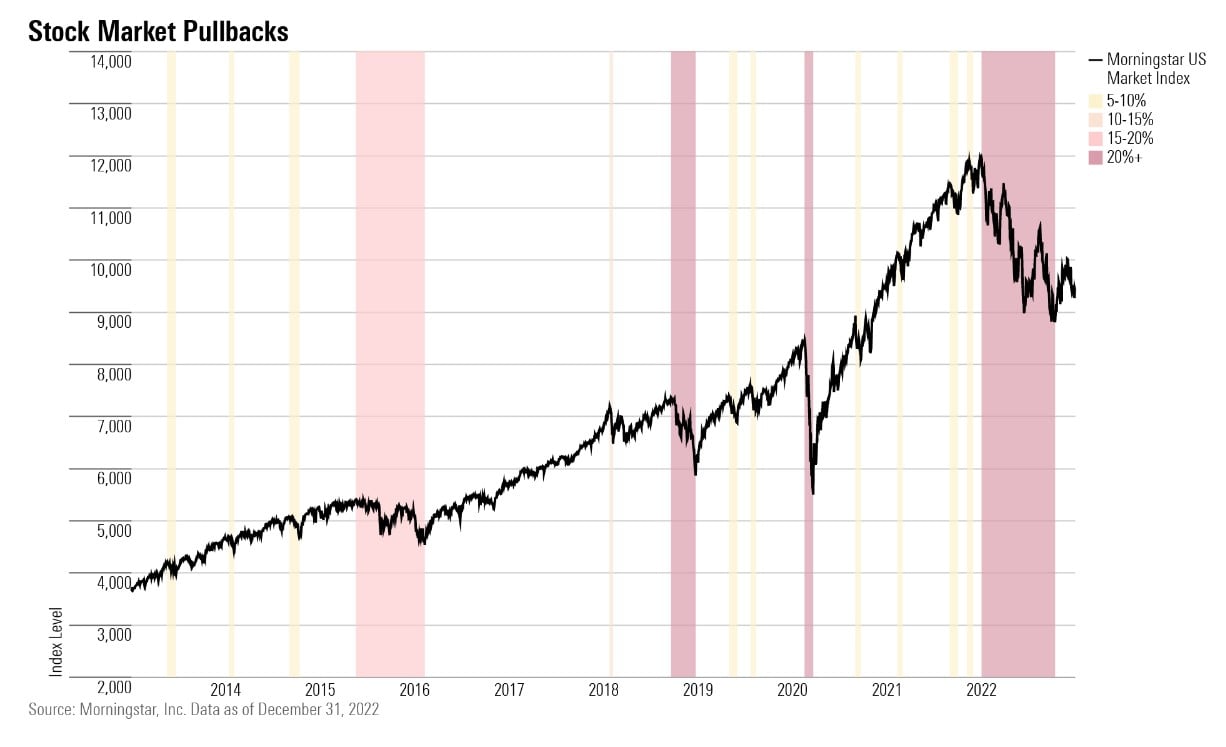
An article from Morningstar has several great charts. (To see them all, click on the link.)