
Chart of the Day: Home Changes in 2023
Today’s Chart of the Day is a survey of builders with data provided by John Burns Real Estate Consulting.
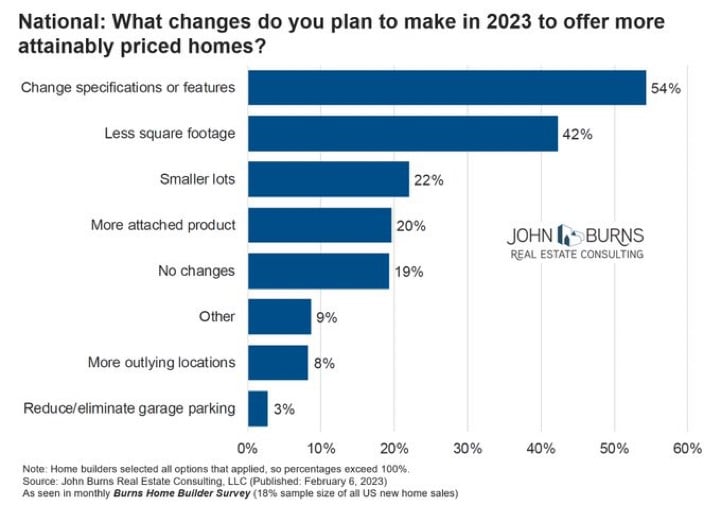
Today’s Chart of the Day is a survey of builders with data provided by John Burns Real Estate Consulting.
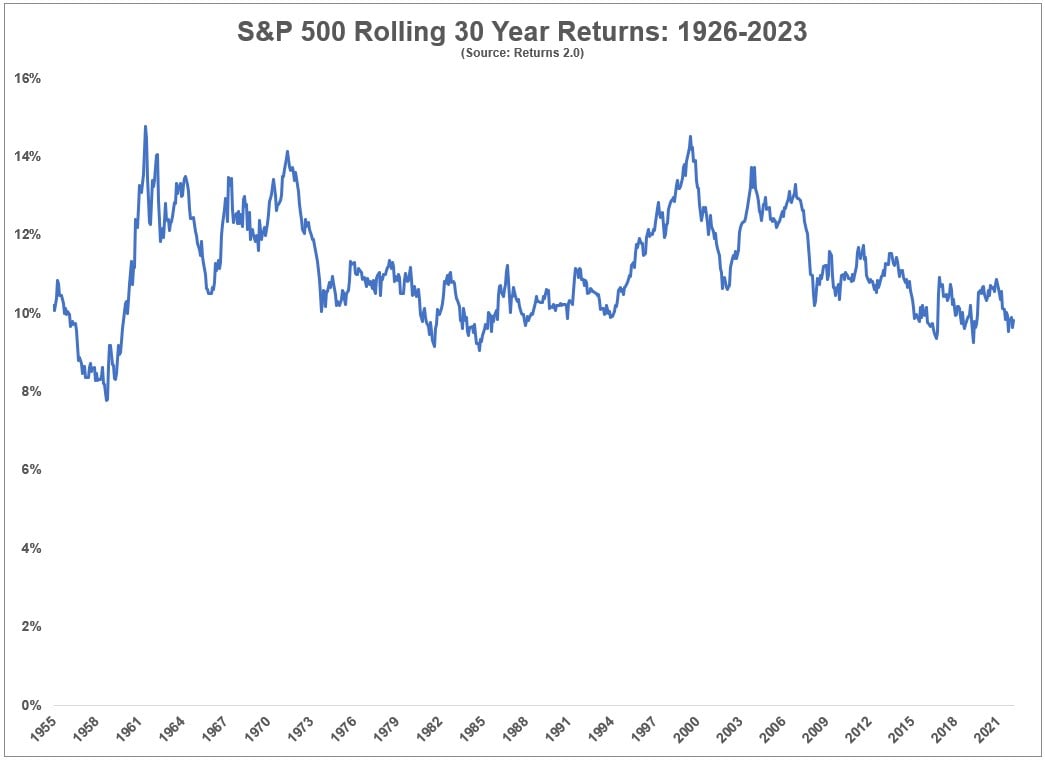
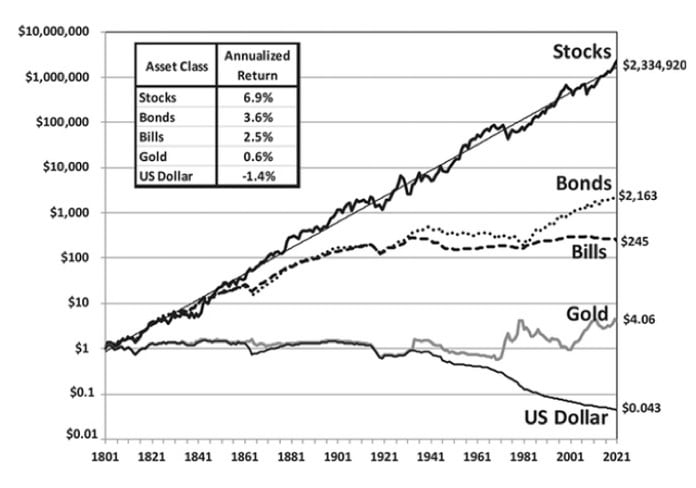
Today’s Chart of the Day comes from an article written by Ben Carlson on A Wealth of Common Sense. The chart shows rolling 30-year returns of the..

Including your favorite charities in your will is a wonderful way to leave a lasting impact and help make the world a better place for future..
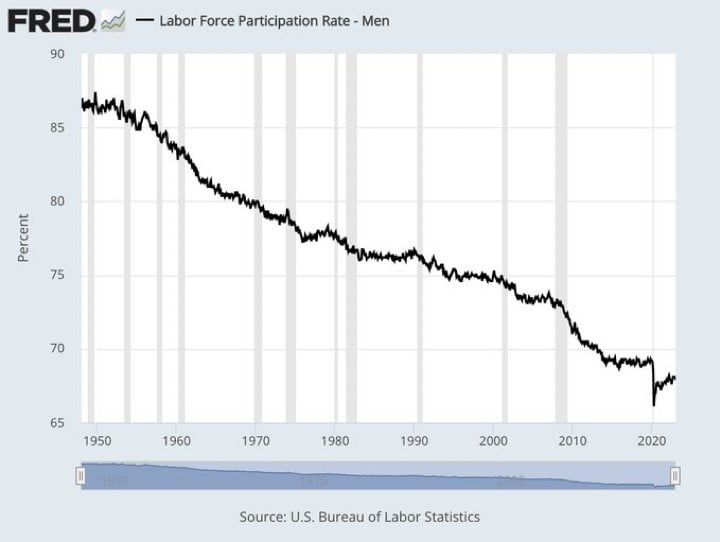
Today’s Chart of the Day comes from FRED (Federal Reserve Economic Data), a fascinating website for charts of economic data.
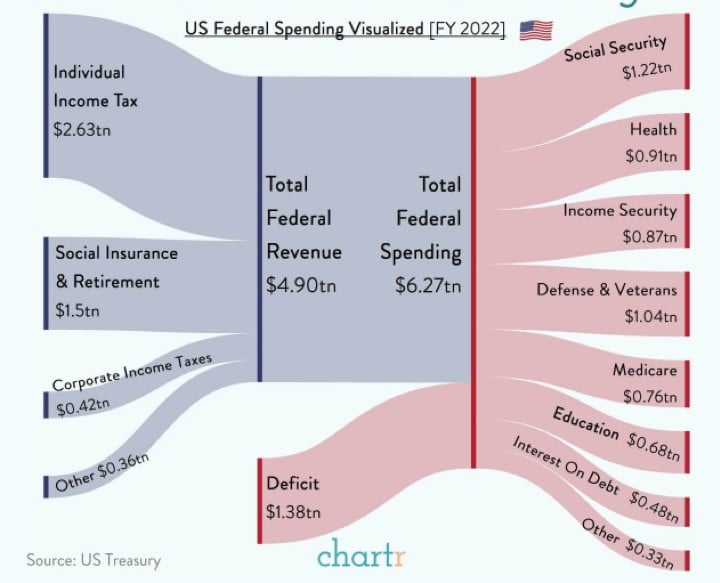
Today’s Chart of the Day comes from chartr with figures provided by the US Treasury to help us understand where our Federal Government taxes and..
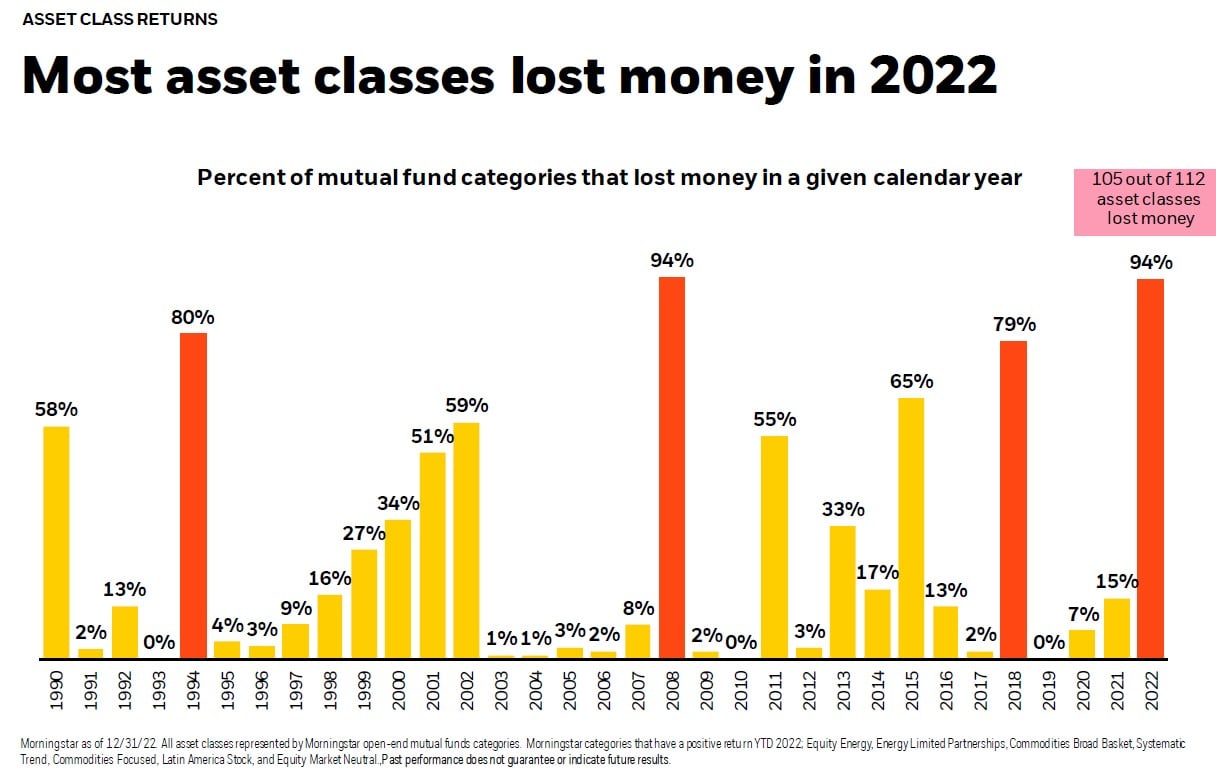
Today’s Chart of the Day comes from BlackRock and shows that 105 of 112 asset classes lost money in 2022.

As a family-owned and operated bank, we pride ourselves on serving the individuals, families, and businesses of Florida by providing premier banking..

As our communities continue to recover from recent hurricanes, and with everyone knee deep in tax season, we are updating a blog from December with..
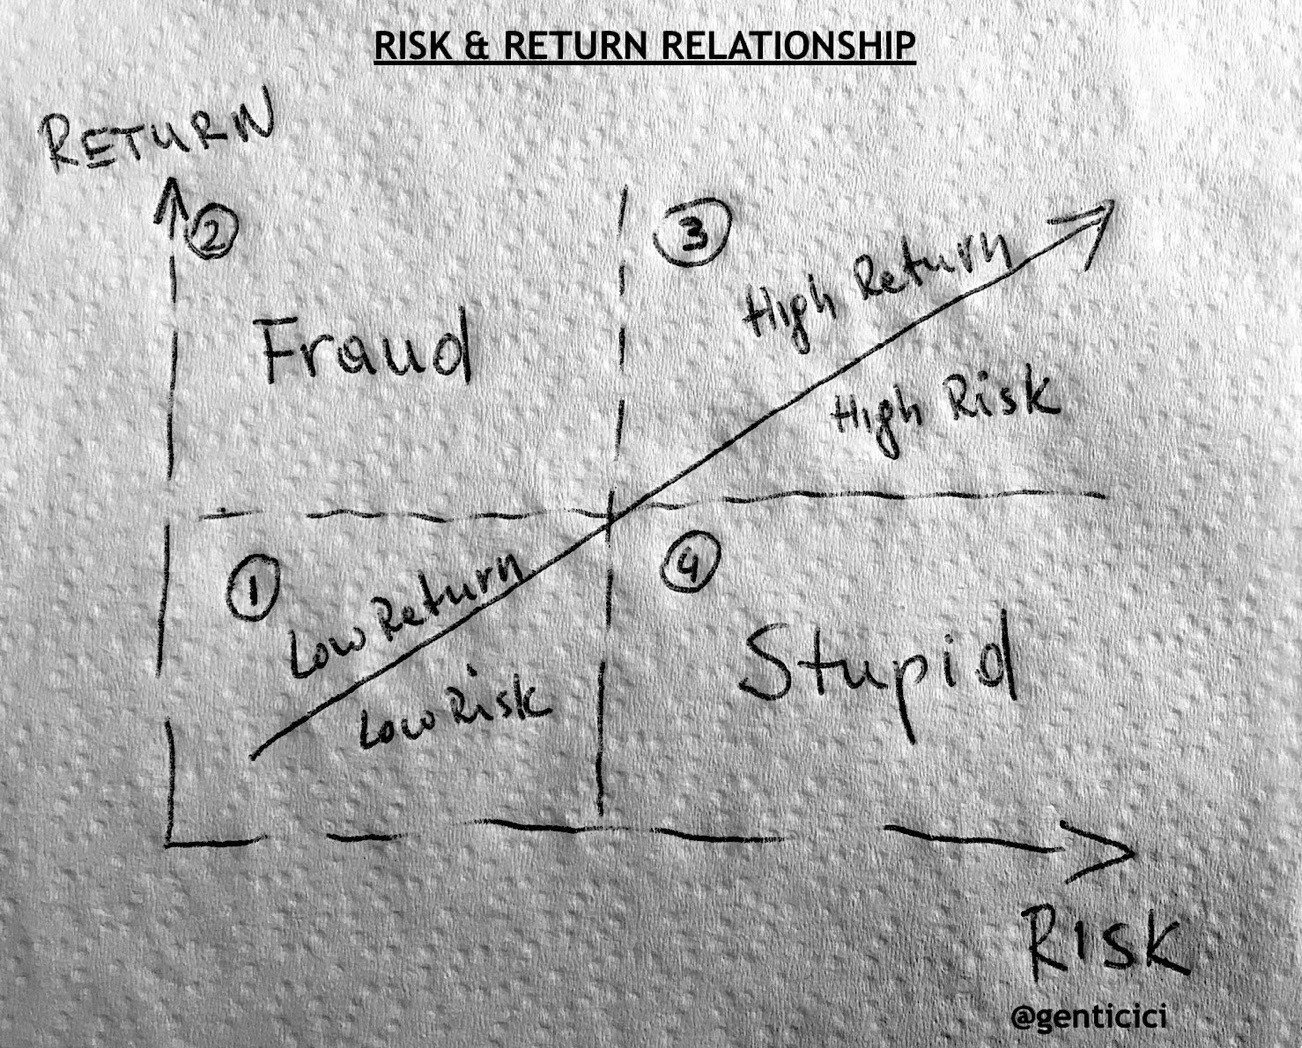
Today’s Chart of the Day comes from @genticici on Twitter. I was impressed by the simplicity of the concept, and it's very apropos to be on the back..
Today’s Chart of the Day is a reoccurring one we like to keep updated with current data.
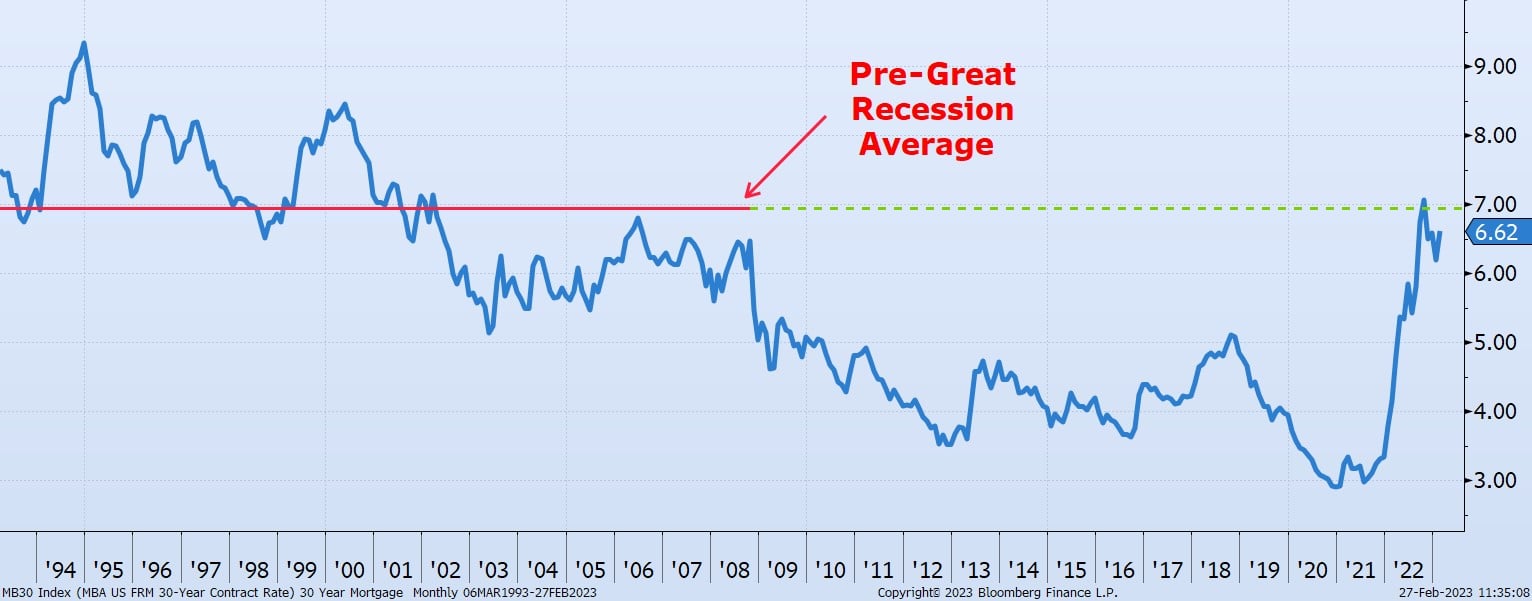
Today's Chart of the Day, compiled from information from the Mortgage Bankers Association, shows the 30-year residential rates dating back to 1993.

The time of low-cost debt has finally come to an end. With skyrocketing rates in 2022 to combat inflation, combined with global financial uncertainty..
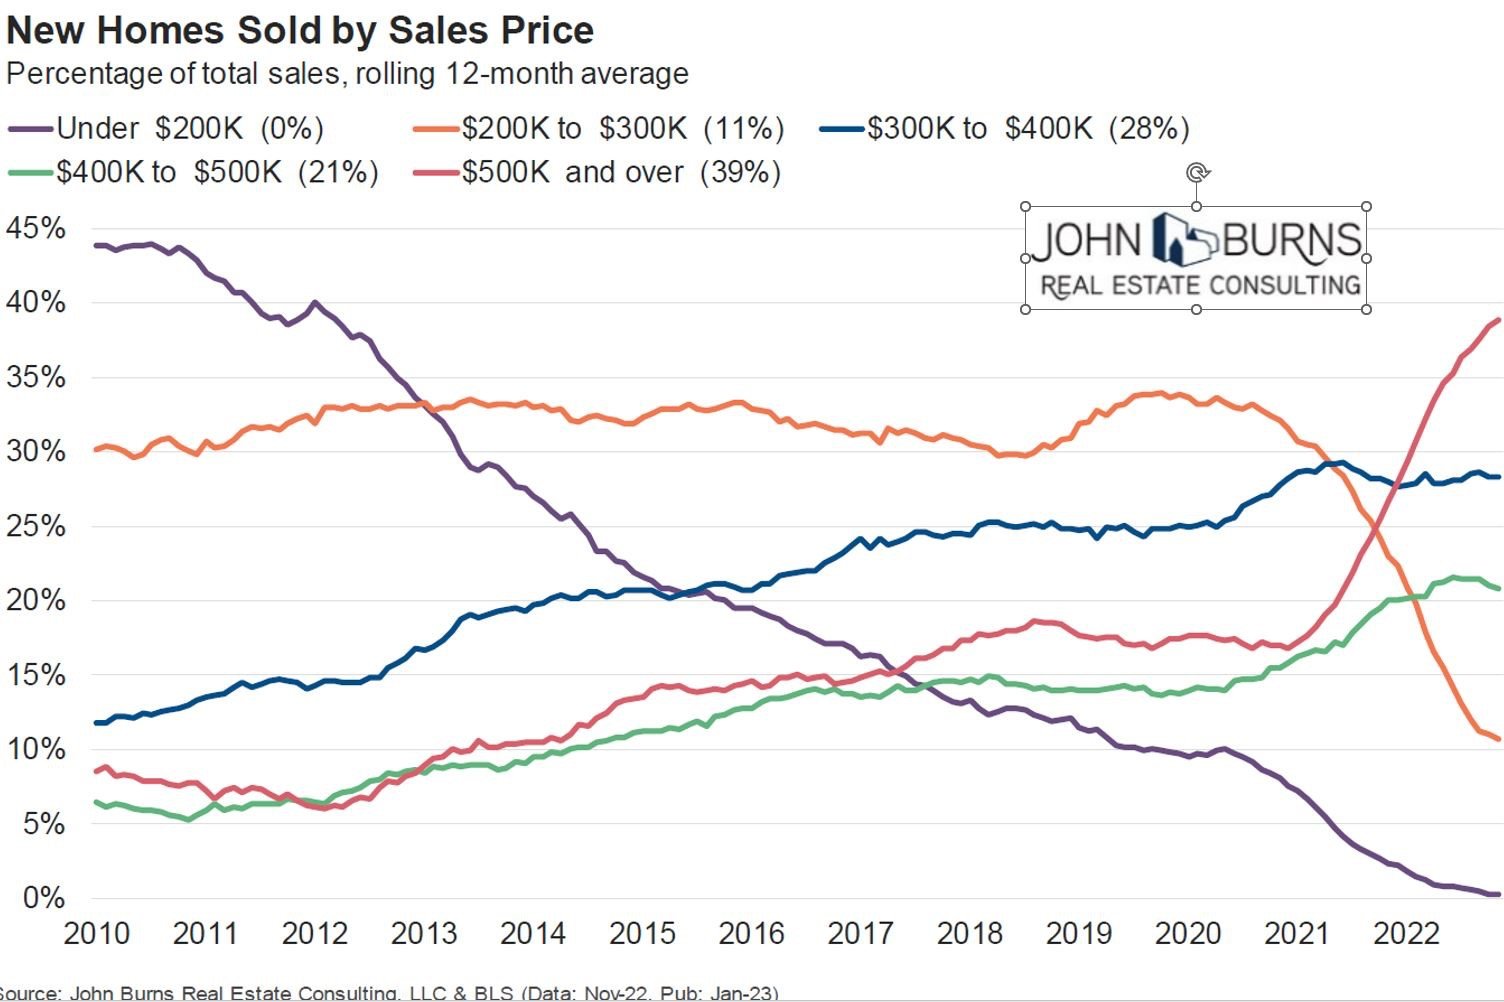
Today’s Chart of the Day comes from John Burns and shows the historical percentages of homes sold by sales price going back to 2010.
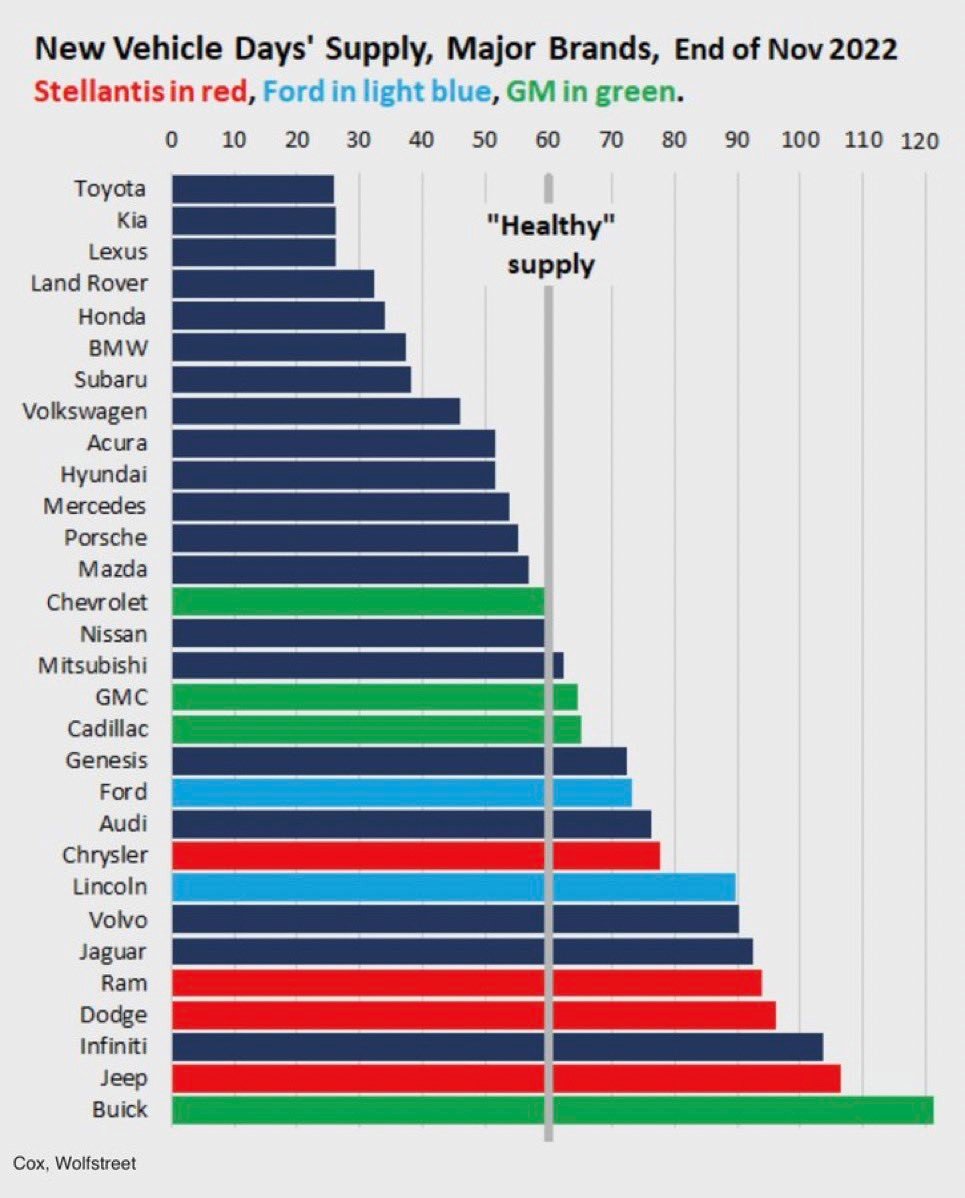
Today’s Chart of the Day comes from Wolfstreet and shows the supply of new vehicles in number of days.
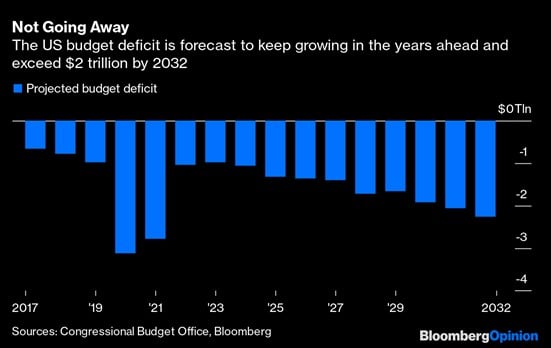
Today’s Chart of the Day is the projected budget deficits for the next 10 years provided by the Congressional Budget Office. It is not a rosy picture.