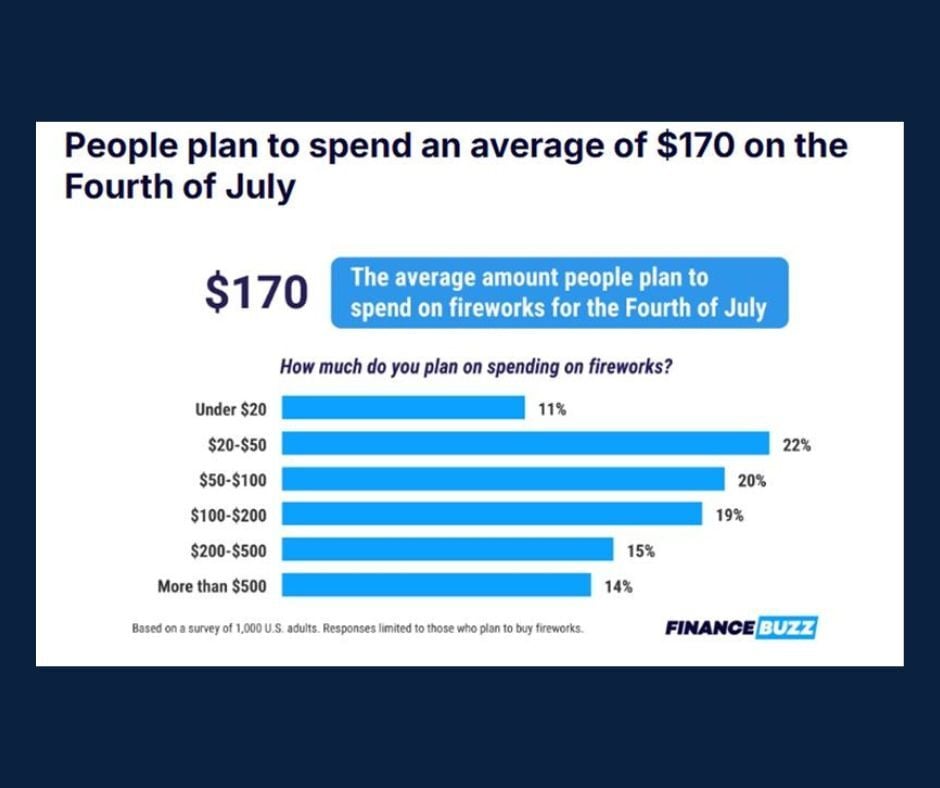
Skip to content

Plan Today. Protect Tomorrow. Attend an Educational Estate-Planning Seminar.

Production of the U.S. penny has officially ended. Learn what this means for you.

Get Started 863-222-7005

Blog

Your Weekly
Financial Forecast


Stay informed with sound financial know-how

Bar chart showing percentages of top-ranking US New Year's resolutions.

Chart of the Day: Top New Year's Resolutions

This chart comes from Statista and displays New Year’s resolution data for 2026.

Read More

Smiling young couple with baby sitting at a banker's desk reviewing documents.

What Happens If You Don’t Have an Estate Plan?

Contrary to popular belief, estate planning isn’t just for the wealthy—it’s for anyone who wants to protect their loved ones and ensure their wishes..

Read More

Line graph illustrating equities and real estate as a percentage of net worth from 1951 to 2025.

Chart of the Day: Net Worth in Stocks

Today's Chart of the Day, shared by dc_economics on Instagram, highlights a shift from historical trends related to household net worth.

Read More

Pie chart showing when Americans last updated their estate plans.

Chart of the Day: Estate Plan Updates - When and Why

Today’s Chart of the Day, prepared by Victoria Lurie at Caring.com, highlights findings from the 2025 Wills and Estate Planning Study.

Read More

Chart with images of pennies, nickels, dimes and quarters showing the face values and cost of making each coin.

Chart of the Day: Does it Make Cents?

Today’s Chart of the Day comes from Kelly Phillips Erb at Forbes and discusses the elimination of the penny in 2025.

Read More

Image of two hands typing on a laptop with ransomware warning appearing on the screen.

Don’t Get Scammed: 15 Fraud Risks to Watch Closely

As we welcome a new year, many of us focus on goals that improve our health, finances, and overall well-being. One resolution that deserves a spot at..

Read More

Line graph showing the number of households with children under the age of 18, from 1950 to present.

Chart of the Day: Age 18 Peaked in 2007

Today’s Chart from Torsten Sløk with Apollo shows that the number of families with children under the age of 18 peaked in 2007 at 37 million and has..

Read More

Map of the U.S. ranking inbound (purple) and outbound (green) relocations by state.

Chart of the Day: Inbound vs. Outbound

Today’s Chart of the Day is from Axios, with data from Atlas Van Lines of their 107,000 residential moves over the last year and shows the percent..

Read More

Image of a tree with leaves representing life events during which one's estate plan should be revisited.

Chart of the Day: Life Changes

Today’s Chart of the Day is from Wealth.com and shows the various reasons why you should revisit (or obtain one if you don’t) your Estate Plan, which..

Read More

Line graph illustrating the average increase in life expectancy, from 1900 to 2023.

Chart of the Day: Life is Longer

Today’s Chart of the Day is from Our World in Data showing that the global average life expectancy went from 32 years in 1900 to 73 years as of 2023.

Read More

concerned professional middle-aged man looking at his credit card, holding a phone.

Stay Safe This Season: 15 Holiday Scams to Avoid

The holiday season is a time for celebration, generosity, and connecting with loved ones. Unfortunately, it’s also a time when scammers ramp up their..

Read More

Bar graph showing how much, by age, one would have to save per month in order to be a millionaire at age 65.

Chart of the Day: How Much to Save

Today’s Chart of the Day from @PeterMallouk is a good one to share with the friends and family who are still working and saving.

Read More

Line graph showing the percentage of Americans that consume alcoholic beverages, from 1940 to present.

Chart of the Day: Lowest Ever Alcohol Consumption

Today’s Chart of the Day is from Gallop and shows the share of Americans that drink alcohol since 1940.

Read More

Line graph showing ages of all home buyers (red), repeat buyers (green), and first-time buyers (yellow) from 1980 to present.

Chart of the Day: First-Time Home Buyers Are Holding Off

Today’s Chart of the Day is from Axios Visuals with data from the National Association of Realtors.

Read More

Overnight versus intraday returns for the SPDR S&P500 ETF (SPY).

Chart of the Day: Day or Night Trading

The topic of Today’s Chart of the Day is something that often crosses my mind in the morning when I look at how the market is going to open.

Read More

On Our Minds

List Grid
Browse by topic

Chart of the Day: Top New Year's Resolutions

This chart comes from Statista and displays New Year’s resolution data for 2026.

More

What Happens If You Don’t Have an Estate Plan?

Contrary to popular belief, estate planning isn’t just for the wealthy—it’s for anyone who wants to protect their loved ones and ensure their wishes are honored. Without an estate plan, you leave critical decisions in the hands of the state and/or someone you may not have chosen, and the consequences can be far from what you intended.

More

Chart of the Day: Net Worth in Stocks

Today's Chart of the Day, shared by dc_economics on Instagram, highlights a shift from historical trends related to household net worth.

More

Chart of the Day: Estate Plan Updates - When and Why

Today’s Chart of the Day, prepared by Victoria Lurie at Caring.com, highlights findings from the 2025 Wills and Estate Planning Study.

More

Chart of the Day: Does it Make Cents?

Today’s Chart of the Day comes from Kelly Phillips Erb at Forbes and discusses the elimination of the penny in 2025.

More

Don’t Get Scammed: 15 Fraud Risks to Watch Closely

As we welcome a new year, many of us focus on goals that improve our health, finances, and overall well-being. One resolution that deserves a spot at the top of your list is protecting yourself from scams. With the use of AI, fraudsters are becoming more sophisticated every year, and being informed is one of the best ways to safeguard your money and your personal information.

More

Chart of the Day: Age 18 Peaked in 2007

Today’s Chart from Torsten Sløk with Apollo shows that the number of families with children under the age of 18 peaked in 2007 at 37 million and has since declined to 33 million. 

More

Chart of the Day: Inbound vs. Outbound

Today’s Chart of the Day is from Axios, with data from Atlas Van Lines of their 107,000 residential moves over the last year and shows the percent change where people are moving to and from.

More

Chart of the Day: Life Changes

Today’s Chart of the Day is from Wealth.com and shows the various reasons why you should revisit (or obtain one if you don’t) your Estate Plan, which often includes a will, power of attorney, living will, health care surrogate, and possibly a trust, if needed.

More

Chart of the Day: Life is Longer

Today’s Chart of the Day is from Our World in Data showing that the global average life expectancy went from 32 years in 1900 to 73 years as of 2023.

More

Stay Safe This Season: 15 Holiday Scams to Avoid

The holiday season is a time for celebration, generosity, and connecting with loved ones. Unfortunately, it’s also a time when scammers ramp up their efforts. With more shopping, traveling, donating, and digital activity happening this time of year, fraudsters see the holidays as the perfect opportunity to take advantage of distracted, overwhelmed, or kind-hearted people.

More

Chart of the Day: How Much to Save

Today’s Chart of the Day from @PeterMallouk is a good one to share with the friends and family who are still working and saving.

More

Chart of the Day: Lowest Ever Alcohol Consumption

Today’s Chart of the Day is from Gallop and shows the share of Americans that drink alcohol since 1940.

More

Chart of the Day: First-Time Home Buyers Are Holding Off

Today’s Chart of the Day is from Axios Visuals with data from the National Association of Realtors.

More

Chart of the Day: Day or Night Trading

The topic of Today’s Chart of the Day is something that often crosses my mind in the morning when I look at how the market is going to open.

More