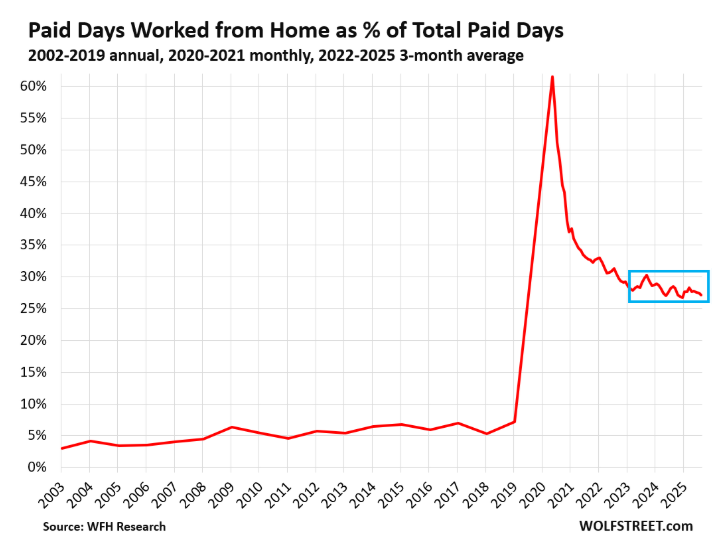
Skip to content
Get Started 863-222-7005

Blog

Your Weekly
Financial Forecast


Stay informed with sound financial know-how

graph shows relationship between buying and renting from 1970 to 2022

Chart of the Day: Buying vs. Renting

Today’s Chart of the Day comes from re:venture in a discussion on Reddit. It's important to remember that the monthly cost to buy (yellow) is usually..

Read More

Building a Foundation of Security: The Importance of Establishing a Trust for Your Disabled Child

When it comes to securing the future of a disabled child, establishing a trust is a powerful and proactive step that parents should consider. A..

Read More

three blue pie charts showing under performance and out performance of three different funds

Chart of the Day: Equal Weight for an Even More Incredible Win

Today’s Chart of the Day is from S&P Global. If you follow my posts, you will not be surprised that over the last 20 years the S&P 500 index, where..

Read More

the declining birth rate is represented by a blue line, data spans from 1980 to 2020

Chart of the Day: US Birth Rates

Today’s Chart of the Day from Econofact.org shows the trend in US birth rates which peaked in 2007 and is now 20% less.

Read More

Commentary of the Day: NASDAQ 100 Concentration

Today’s Chart of the Day is a comment about a unique risk that can occur in successful index funds. For instance, we often hear about what many call..

Read More

S&P 500 top holdings over the years including Wal-Mart, Amazon, Shell, and Coke

Chart of the Day: Winners May Not Always be Winners

Today’s Chart of the Day comes from A Wealth of Common Sense and shows the top 10 companies in the stock market going back to 1980.

Read More

Chart of the Day: Invest from the Start

Today’s Chart of the Day comes from @QCompounding on Twitter and shows the value of some well-known companies now vs. when they became publicly owned.

Read More

Chart of the Day: 60% of People Own Stocks

Today’s Chart of the Day from an article called “Best Time to Buy Stocks” shows the percentage of households that own stocks of any form. Besides a..

Read More

green beachy building with palm tree out front

1031 (CRE) Exchanges: What You Need to Know

If you’re a real estate investor hoping to expand your portfolio, you may want to consider a 1031 exchange. A 1031 can be a great way to purchase..

Read More

Chart of the Day: Beef vs. Pork

Today’s Chart of the Day from the Wall Street Journal shows that you aren’t imagining that beef prices have gone up. Beef prices have increased..

Read More

Chart of the Day: Pandemic Credit Card Usage

Today’s Chart of the Day from @CharlieBiello on Twitter shows the annual change in credit card balances dating back to 2000. The latest data shows a..

Read More

Harnessing Financial Confidence Amidst an Election Year: Navigating Uncertainty with Strategy

Election years can be unsettling times, as political campaigns dominate headlines and uncertainty looms in the air. It's common for individuals and..

Read More

bar chart representing different fund sizes and random

Chart of the Day: Sell Your Winners AND Your Losers

Today’s Chart of the Day comes from Craig Lazzara's article “Persistently Disappointing.” It asks if top fund managers outperform due to skill or..

Read More

Chart of the Day: Returns are Rarely Normal

Today’s Chart of the Day comes from A Wealth of Common Sense showing the range of annual returns over the last 95 years. The long-term average is 10%..

Read More

Chart of the Day: TV is Still Top

Today’s Chart of the Day is from the recent Harvard Caps/Harris poll. After all of these years, at 43%, TV is still the principal place people get..

Read More

On Our Minds

List Grid
Browse by topic

Chart of the Day: Buying vs. Renting

Today’s Chart of the Day comes from re:venture in a discussion on Reddit. It's important to remember that the monthly cost to buy (yellow) is usually more than the cost to rent (blue), but a large difference between the two is not sustainable.

More

Building a Foundation of Security: The Importance of Establishing a Trust for Your Disabled Child

When it comes to securing the future of a disabled child, establishing a trust is a powerful and proactive step that parents should consider. A special needs trust or a supplemental needs trust provides financial stability, asset protection, and preserves eligibility for government benefits. Together we will delve into the key reasons why establishing a trust for a disabled child is crucial and how it can provide long-term security and peace of mind for both the child and their family.

More

Chart of the Day: Equal Weight for an Even More Incredible Win


Today’s Chart of the Day is from S&P Global. If you follow my posts, you will not be surprised that over the last 20 years the S&P 500 index, where larger companies make up more of the index than smaller ones, beat actively managed funds an incredible 92.4% of the time. That is a high bar to beat.

More

Chart of the Day: US Birth Rates

Today’s Chart of the Day from Econofact.org shows the trend in US birth rates which peaked in 2007 and is now 20% less.

More

Commentary of the Day: NASDAQ 100 Concentration

Today’s Chart of the Day is a comment about a unique risk that can occur in successful index funds. For instance, we often hear about what many call the “Tech-Heavy NASDAQ” which refers to the Invesco QQQ Trust Exchange Traded Fund (ETF), the 5th largest exchange-traded fund in the US.

More

Chart of the Day: Winners May Not Always be Winners

Today’s Chart of the Day comes from A Wealth of Common Sense and shows the top 10 companies in the stock market going back to 1980.

More

Chart of the Day: Invest from the Start

Today’s Chart of the Day comes from @QCompounding on Twitter and shows the value of some well-known companies now vs. when they became publicly owned.

More

Chart of the Day: 60% of People Own Stocks

Today’s Chart of the Day from an article called “Best Time to Buy Stocks” shows the percentage of households that own stocks of any form. Besides a slight decline after the Great Recession, the percentage has held steady between 50%-60% of the US population and currently stands at 61%. 

More

1031 (CRE) Exchanges: What You Need to Know

If you’re a real estate investor hoping to expand your portfolio, you may want to consider a 1031 exchange. A 1031 can be a great way to purchase commercial real estate without having to immediately pay the properties’ capital gains taxes. By saving money on your taxes, you can use the funds to invest further, make improvements to the property, or consolidate your portfolio. But how do you know if a 1031 is your best option? We’ll explain what a 1031 is, how it works, and whether or not it’s a good investment for you.

More

Chart of the Day: Beef vs. Pork

Today’s Chart of the Day from the Wall Street Journal shows that you aren’t imagining that beef prices have gone up. Beef prices have increased significantly versus chicken and pork since the pandemic.

More

Chart of the Day: Pandemic Credit Card Usage

Today’s Chart of the Day from @CharlieBiello on Twitter shows the annual change in credit card balances dating back to 2000. The latest data shows a 17.2% increase, nearing the record set in 2001 at 18.9%. This is another unintended consequence of the COVID-19 pandemic response.

More

Harnessing Financial Confidence Amidst an Election Year: Navigating Uncertainty with Strategy

Election years can be unsettling times, as political campaigns dominate headlines and uncertainty looms in the air. It's common for individuals and businesses to feel anxious about the potential financial impacts that elections can bring. However, it's crucial to remember that maintaining financial confidence during these periods is essential for making informed decisions and achieving long-term financial goals. In this blog, we'll explore strategies and mindset shifts that can help instill financial confidence and empower you to navigate the uncertainty of an election year.

More

Chart of the Day: Sell Your Winners AND Your Losers

Today’s Chart of the Day comes from Craig Lazzara's article “Persistently Disappointing.” It asks if top fund managers outperform due to skill or good luck. In EVERY fund category and over EVERY time frame, it was found to simply be good luck.

More

Chart of the Day: Returns are Rarely Normal

Today’s Chart of the Day comes from A Wealth of Common Sense showing the range of annual returns over the last 95 years. The long-term average is 10% over the entire period.

More

Chart of the Day: TV is Still Top

Today’s Chart of the Day is from the recent Harvard Caps/Harris poll. After all of these years, at 43%, TV is still the principal place people get their news.

More